Top 30 Driest YEARS - WINNIPEG (since 1873)
|
Rank |
Rainfall
(mm) |
Snowfall
(cm) |
Precipitation
(mm) |
Rank |
|||
|
1 |
206.8 |
1936 |
48.3 |
1877 |
304.8 |
2020 E |
1 |
|
2 |
223.5 |
2006
E |
58.5 |
1981 |
320.9 |
1961 |
2 |
|
3 |
229.6 |
1881 E |
59.8 |
1913 |
337.0 |
2006 E |
3 |
|
4 |
232.8 |
1961 |
63.6 |
1886 |
342.8 |
2017
E |
4 |
|
5 |
235.3 |
1938 |
65.1 |
1939 |
349.9 |
1917 |
5 |
|
6 |
237.8 |
2020
E |
66.3 |
1901 |
362.1 |
1952 |
6 |
|
7 |
248.1 |
1889 |
69.4 |
1927 |
363.6 |
1929 |
7 |
|
8 |
248.5 |
1917 |
70.1 |
1928 |
373.4 |
2023
E |
8 |
|
9 |
252.4 |
1929 |
71.1 |
1912 |
374.7 |
1881 E |
9 |
|
10 |
261.0 |
1925 |
71.8 |
1993 |
379.8 |
1889 |
10 |
|
11 |
262.9 |
1923 |
72.4 |
1952 |
380.7 |
1988 |
11 |
|
12 |
281.2 |
1875
E |
73.2 |
1994
C |
382.6 |
1886
C |
12 |
|
13 |
283.2 |
1894 |
74.8 |
1982 PL |
390.1 |
2011 E |
13 |
|
14 |
285.3 |
1988 |
75.2 |
1880 |
391.2 |
1938
O |
14 |
|
15 |
287.1 |
2017 E |
75.6 |
1878 E |
391.6 |
1936 |
15 |
|
16 |
289.8 |
1907 |
75.8 |
1968 |
393.2 |
1990 |
16 |
|
17 |
289.8 |
1952 |
76.2 |
1973 |
393.9 |
2021 E |
17 |
|
18 |
291.6 |
1960 |
83.0 |
1951 |
395.9 |
1960 |
18 |
|
19 |
294.0 |
1920 |
84.0 |
1978 |
396.1 |
2018 E |
19 |
|
20 |
298.1 |
1887 |
84.3 |
1946 |
398.9 |
1923 |
20 |
|
21 |
300.6 |
1948 |
84.4 |
2001 E |
401.5 |
1913 |
21 |
|
22 |
307.3 |
1888 |
85.4 |
1900 |
403.8 |
1951 |
22 |
|
23 |
307.3 |
1980 |
87.4 |
1987 C+PL |
404.4 |
1948 |
23 |
|
24 |
308.9 |
1990 |
87.9 |
1931 |
405.3 |
1980 |
24 |
|
25 |
309.2 |
2011 E |
88.8 |
1977 |
407.9 |
1875 E |
25 |
|
26 |
312.3 |
1910
C |
89.5 |
1924 |
408.6 |
1925 |
26 |
|
27 |
314.1 |
1966 |
89.6 |
2017 |
412.0 |
2003 E |
27 |
|
28 |
314.2 |
1885 |
89.8 |
1983 |
415.2 |
1946 |
28 |
|
29 |
314.3 |
2021 E |
89.9 |
1911 E |
419.0 |
1939 |
29 |
|
30 |
315.0 |
2003
E |
91.4 |
1957 |
422.3 |
1885 |
30 |
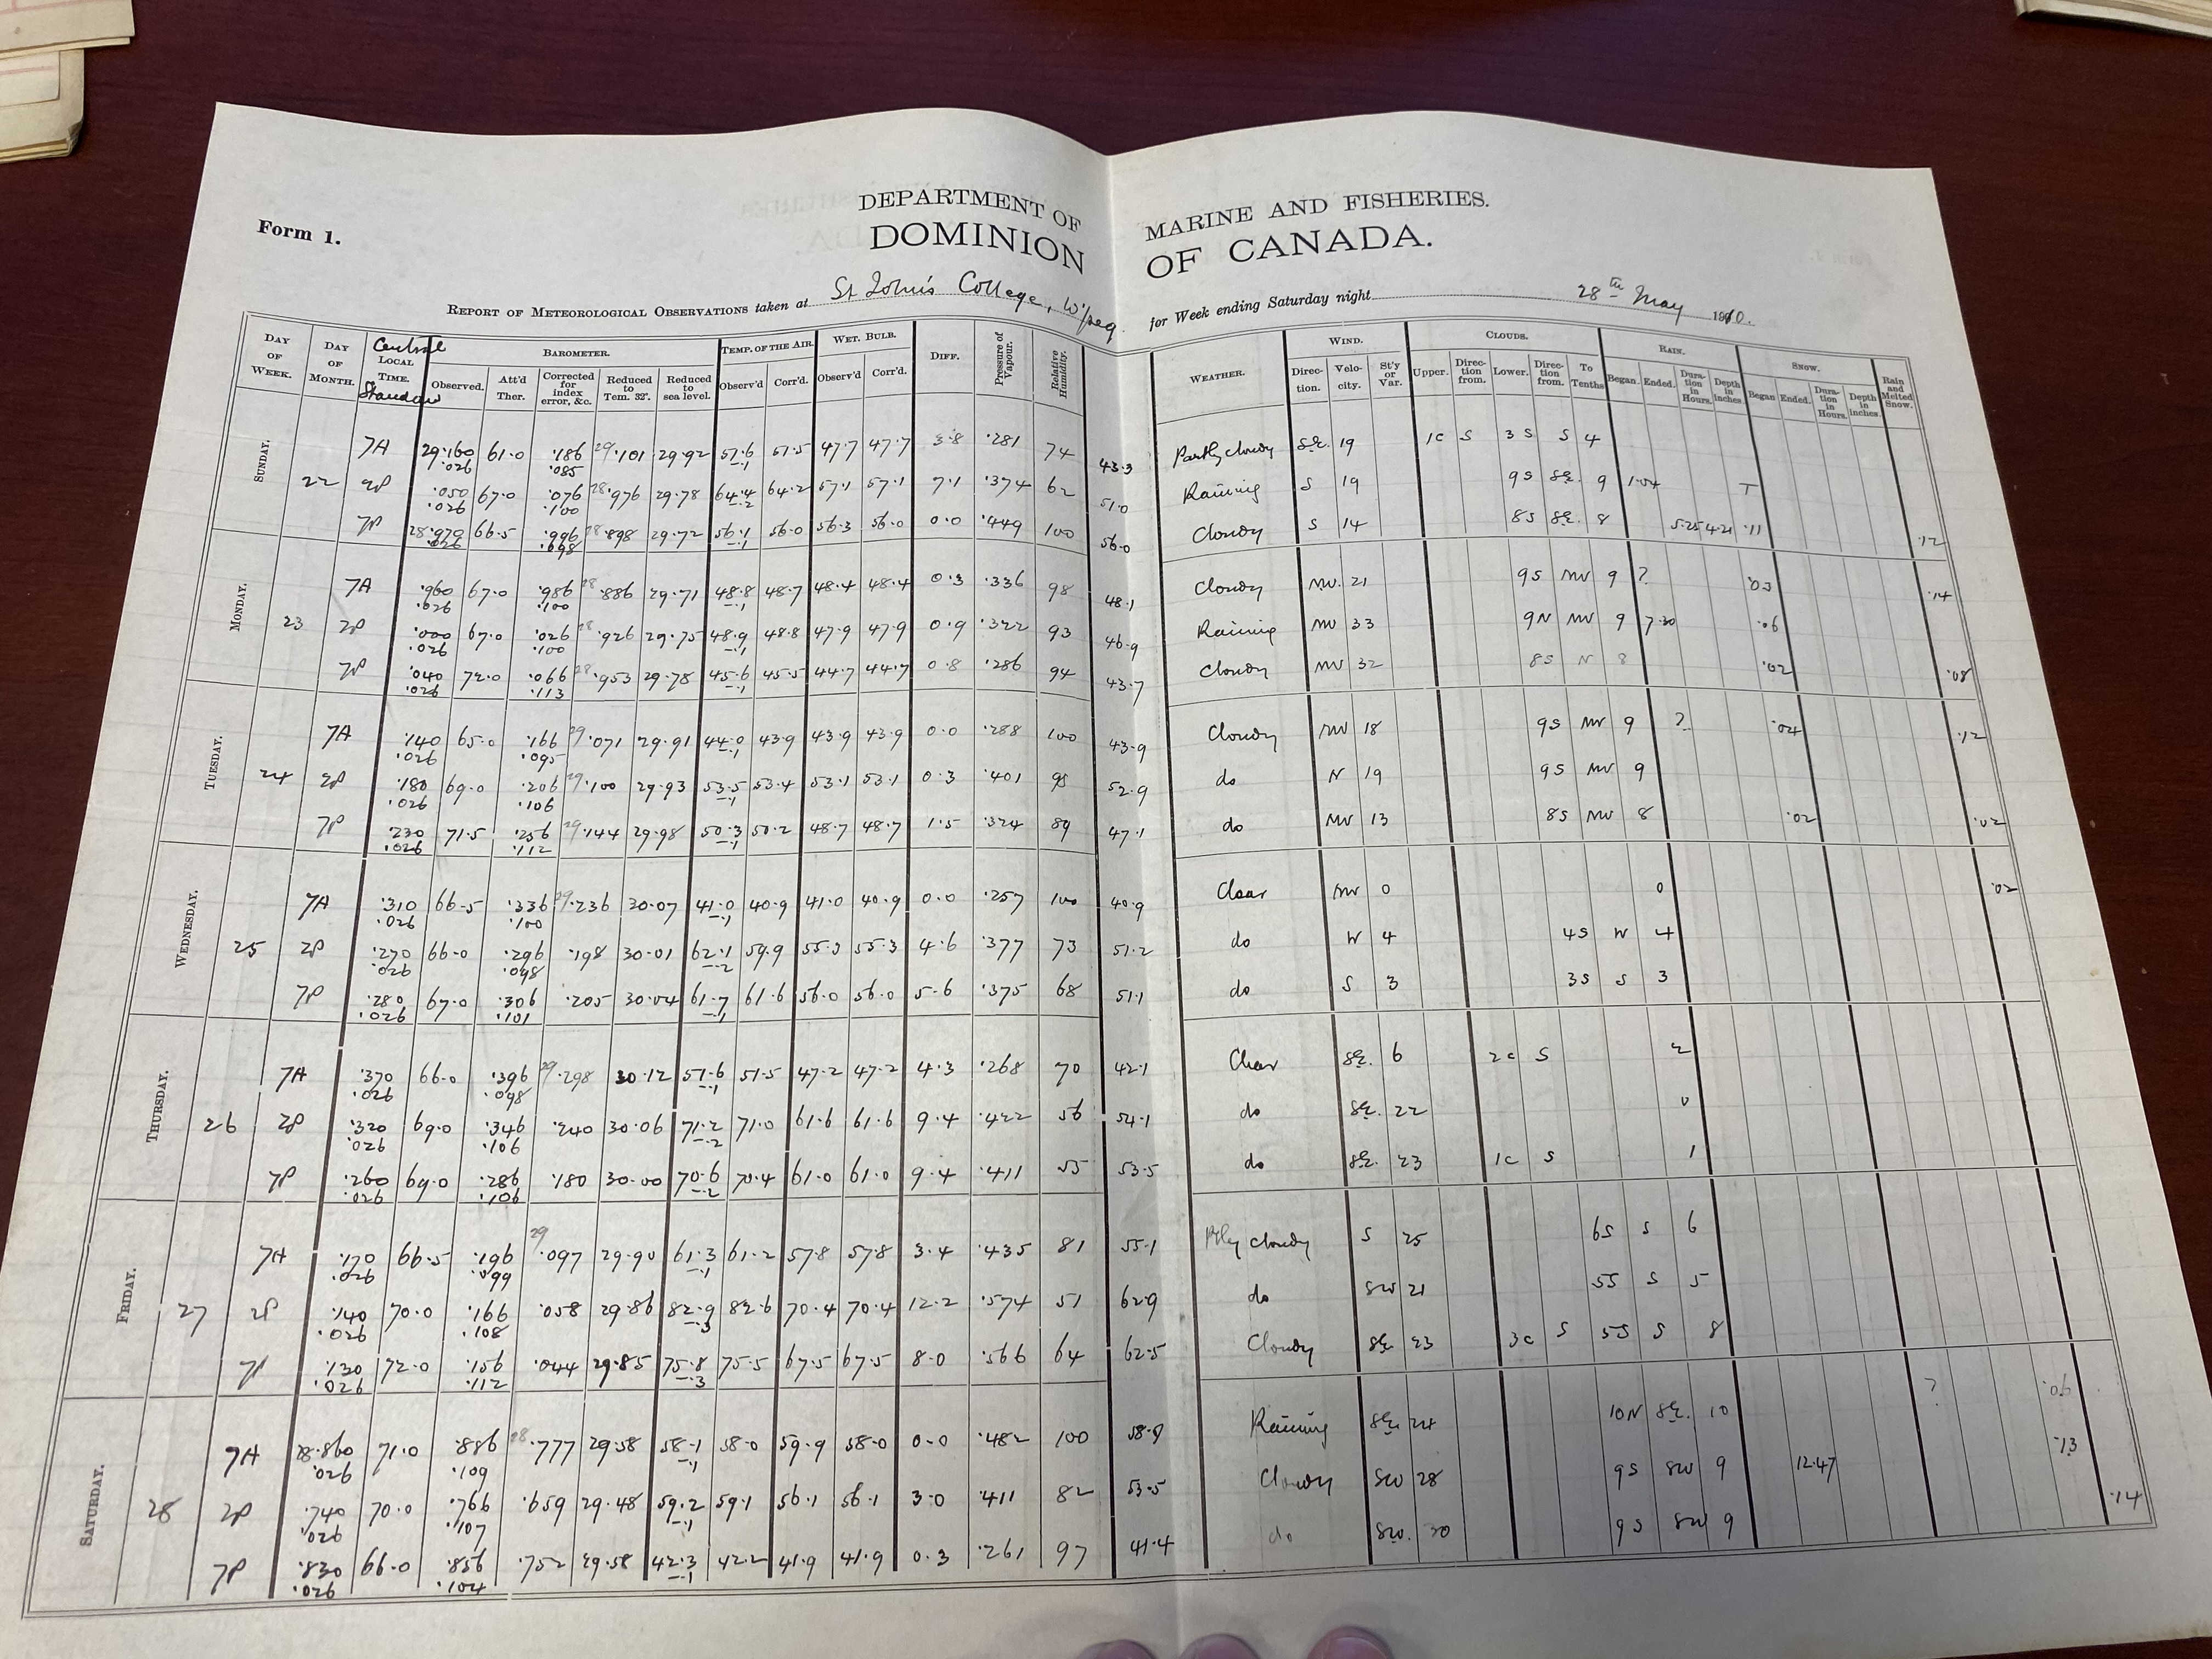
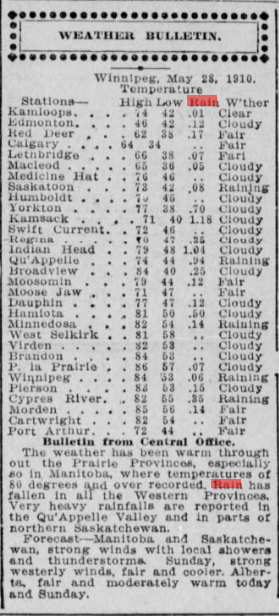
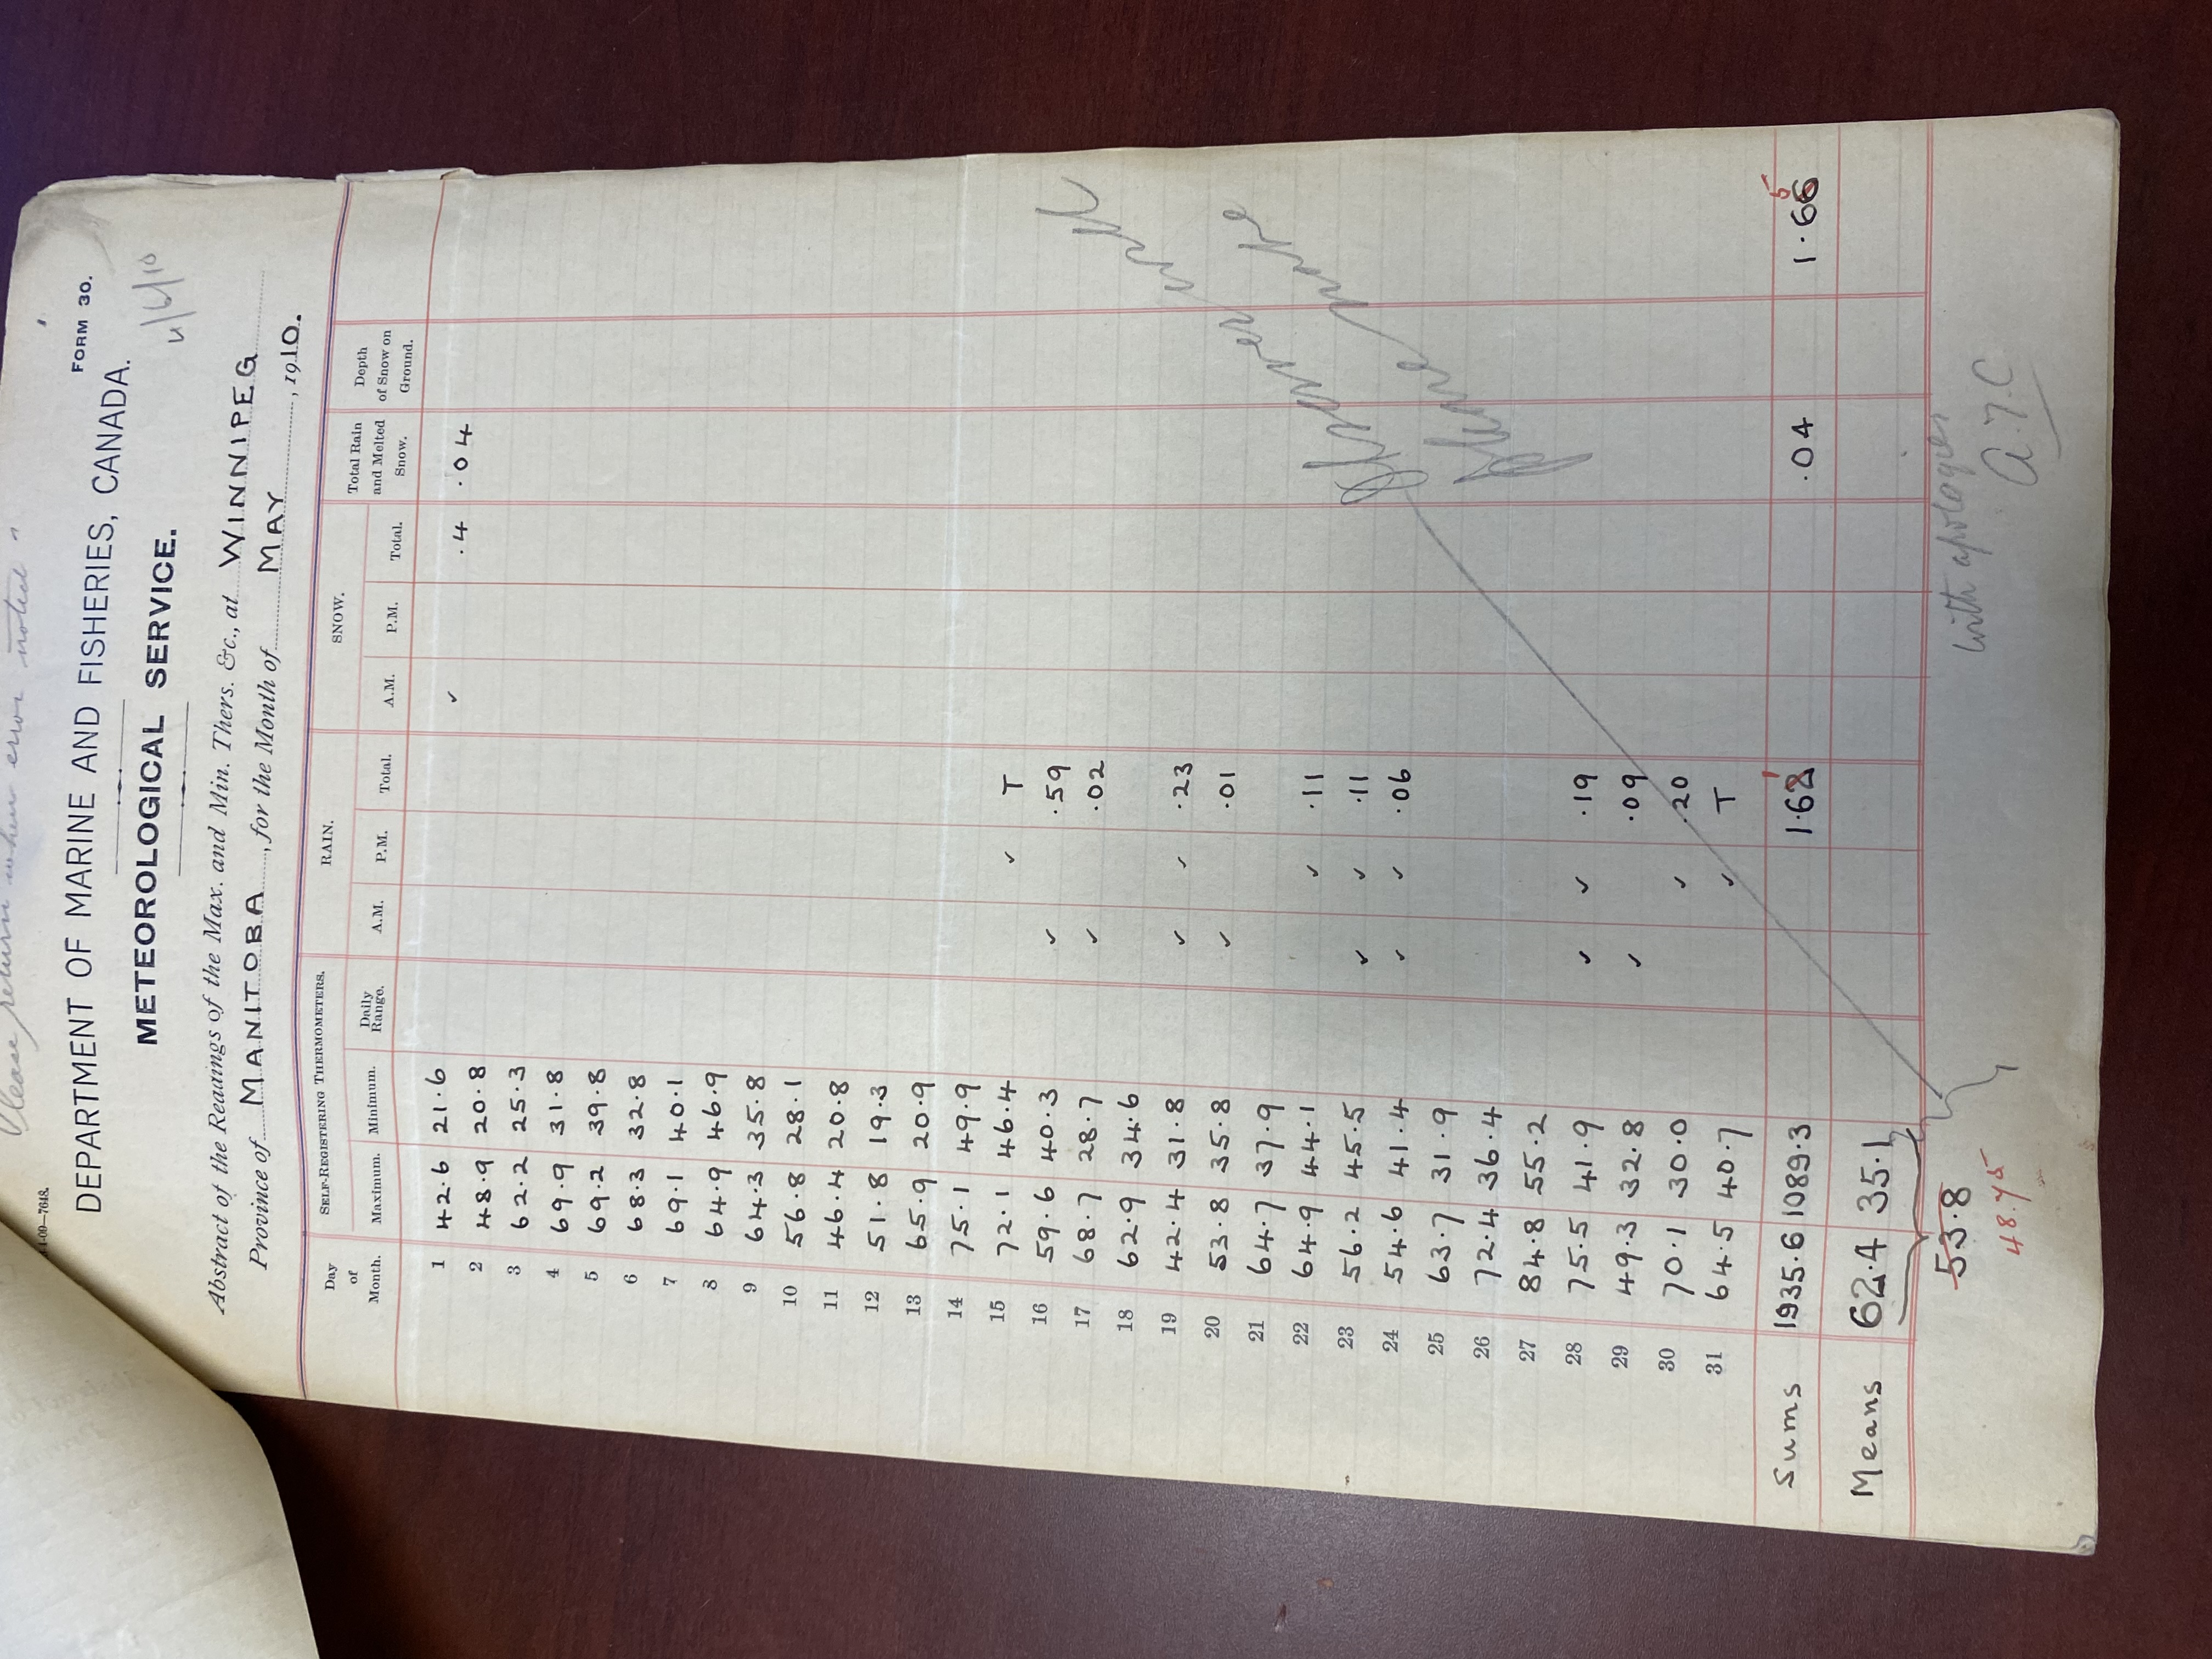
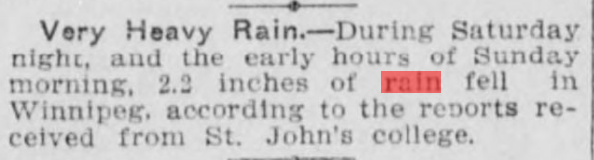
1910 - 4.8 cm snowfall on May 28 was erroneous and eliminated, resulting in a reduction of 4.8 cm for the year. Observer notes from St John's College revealed that the rain amounts were mistakenly entered in the snow column for the date. Further evidenced by the fact that the snow amounts were entered when temperatures were 14-15c, far too warm for snow to fall. The observer, in their notes, also reported that rain was falling, not snow. The monthly summary from the observer showed no snow, and instead rain (4.8 mm) on the date. In addition, newspapers (note that this paper's 2.2 inches of rain is an error for 0.22 inches) had no mention of snowfall. They instead talked about rains that fell. As a result, rainfall amounts for the year were increased by 4.8 mm as a result of the switch from snow to rain.
1911 - Observer notes from St John's College show 0.5 cm of snow during the night Jan 26-27 that is not in the Archives. I have added it as a result, resulting in 89.9 cm for the year rather than the original 89.4 cm. I have used the ''E'' for estimate flag given the absence of any other evidence of the snowfall.
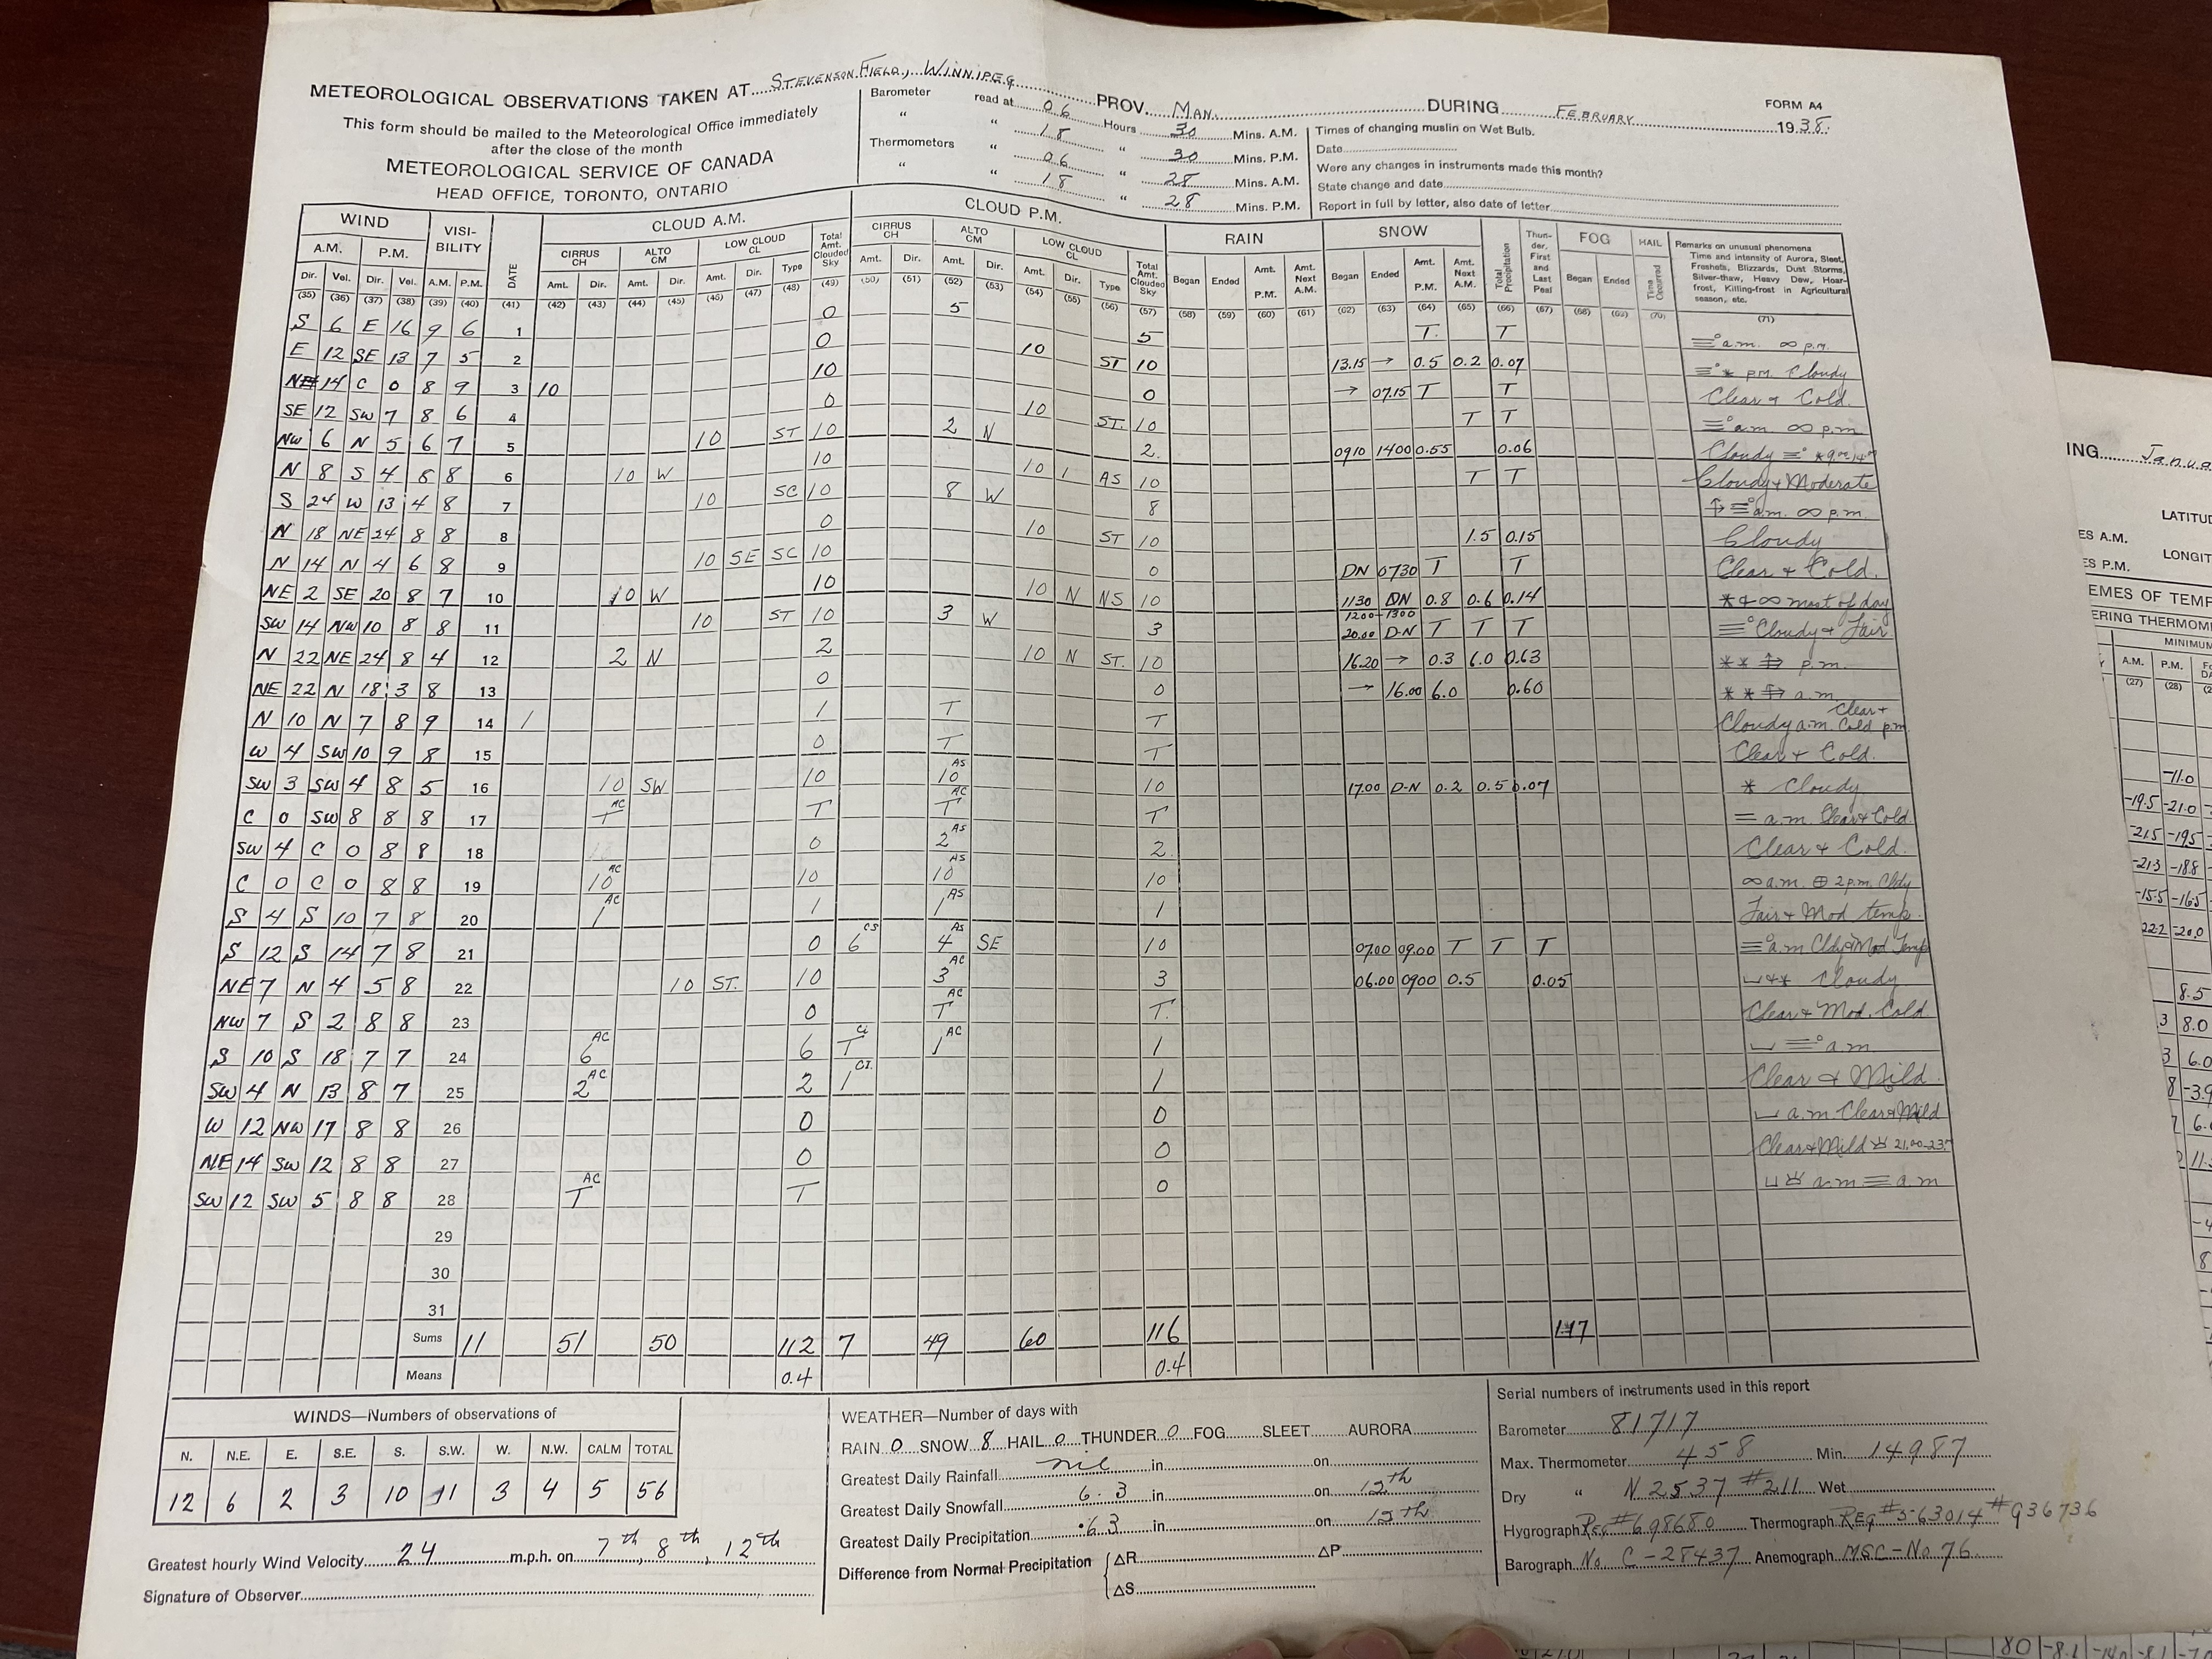
1938 - Missing data at the Airport for February were found at the Library Archives of Canada in Winnipeg. Using this data raised the yearly precip amount by 1.3 mm.
1982 - 0.6 cm on Oct 16 was actually ice pellets assumed at 10:1 ratio. This 0.6 cm is not true snowfall accumulation as a result.
1987 - See December 1987.
2023 - The Forks and Weatherlogics sometimes used as replacement for snow-water equivalent when the Airport under caught snowfall in March, April, October, November and December. An issue of hourly precip duplication also resulted in precip amounts that were too high at the Airport on November 7 and 12. The ECCC Datamart was used to retrieve the correct precipitation amounts for these dates. All these corrections resulted in a net small difference in precip - raw airport is 373.8 mm, while my corrected value is 373.4 mm.
Graphs:
Rainfall:


