Top 30 Wettest APRILS - WINNIPEG (since 1872)
|
Rank |
Rainfall
(mm) |
Snowfall
(cm) |
Precipitation
(mm) |
Rank |
|||
|
1 |
138.2 |
1896 |
48.6 |
1997 |
143.3 |
1896 |
1 |
|
2 |
95.7 |
2022
E |
46.0 |
1999
PL |
123.0 |
2022
U |
2 |
|
3 |
90.4 |
1878 |
44.5 |
1872 |
98.3 |
1986 |
3 |
|
4 |
89.7 |
1963 |
42.6 |
2022 |
98.0 |
1878 |
4 |
|
5 |
86.3 |
1986 |
40.9 |
1950 |
90.4 |
1894 |
5 |
|
6 |
70.6 |
1924 |
38.4 |
1996 |
90.4 |
1963 |
6 |
|
7 |
64.8 |
1879 |
37.6 |
1893 |
89.4 |
1924 |
7 |
|
8 |
64.5 |
1894 |
37.1 |
1966 |
79.3 |
1991 |
8 |
|
9 |
56.9 |
1967 |
36.8 |
1909 |
76.6 |
1997 |
9 |
|
10 |
55.9 |
1942 |
35.1 |
1970 |
73.5 |
1979 |
10 |
|
11 |
54.9 |
1927 |
33.8 |
1953 |
72.6 |
1967 |
11 |
|
12 |
52.6 |
1948 |
33.0 |
1884 |
70.6 |
1879 |
12 |
|
13 |
51.8 |
1954 |
32.0 |
1937 |
70.1 |
1954 |
13 |
|
14 |
50.0 |
1974 |
30.2 |
2003 |
68.3 |
1884 |
14 |
|
15 |
49.0 |
1911 |
29.8 |
2020 |
67.1 |
1937 |
15 |
|
16 |
47.8 |
1979 |
29.7 |
1892 |
65.3 |
1911 |
16 |
|
17 |
47.0 |
1991 |
27.2 |
1910 |
65.3 |
1970 |
17 |
|
18 |
46.5 |
1901 |
25.9 |
1894 |
64.8 |
1892 |
18 |
|
19 |
46.2 |
1885 |
25.1 |
1907 |
64.8 |
1965 |
19 |
|
20 |
45.0 |
1971 |
25.0 |
2021 |
63.2 |
1942 |
20 |
|
21 |
44.5 |
1965 |
23.4 |
1991 |
61.7 |
1927 |
21 |
|
22 |
43.9 |
1886 |
23.1 |
1965 |
60.2 |
1971 |
22 |
|
23 |
43.7 |
1899 |
22.9 |
1960 |
58.7 |
1974 |
23 |
|
24 |
43.7 |
1921 |
22.7 |
1979 |
58.4 |
1893 |
24 |
|
25 |
43.0 |
2011 E |
22.6 |
1887 |
57.7 |
1872 |
25 |
|
26 |
42.9 |
1984 |
22.1 |
1964 |
57.2 |
1912 |
26 |
|
27 |
42.4 |
1912 |
20.3 |
1875 O |
55.1 |
1899 |
27 |
|
28 |
41.9 |
1975 |
19.8 |
1874 |
54.4 |
1964 |
28 |
|
29 |
41.7 |
1906 |
19.8 |
1933 |
54.1 |
1948 |
29 |
|
30 |
38.9 |
2016 E |
19.8 |
1967 |
53.6 |
1996 |
30 |
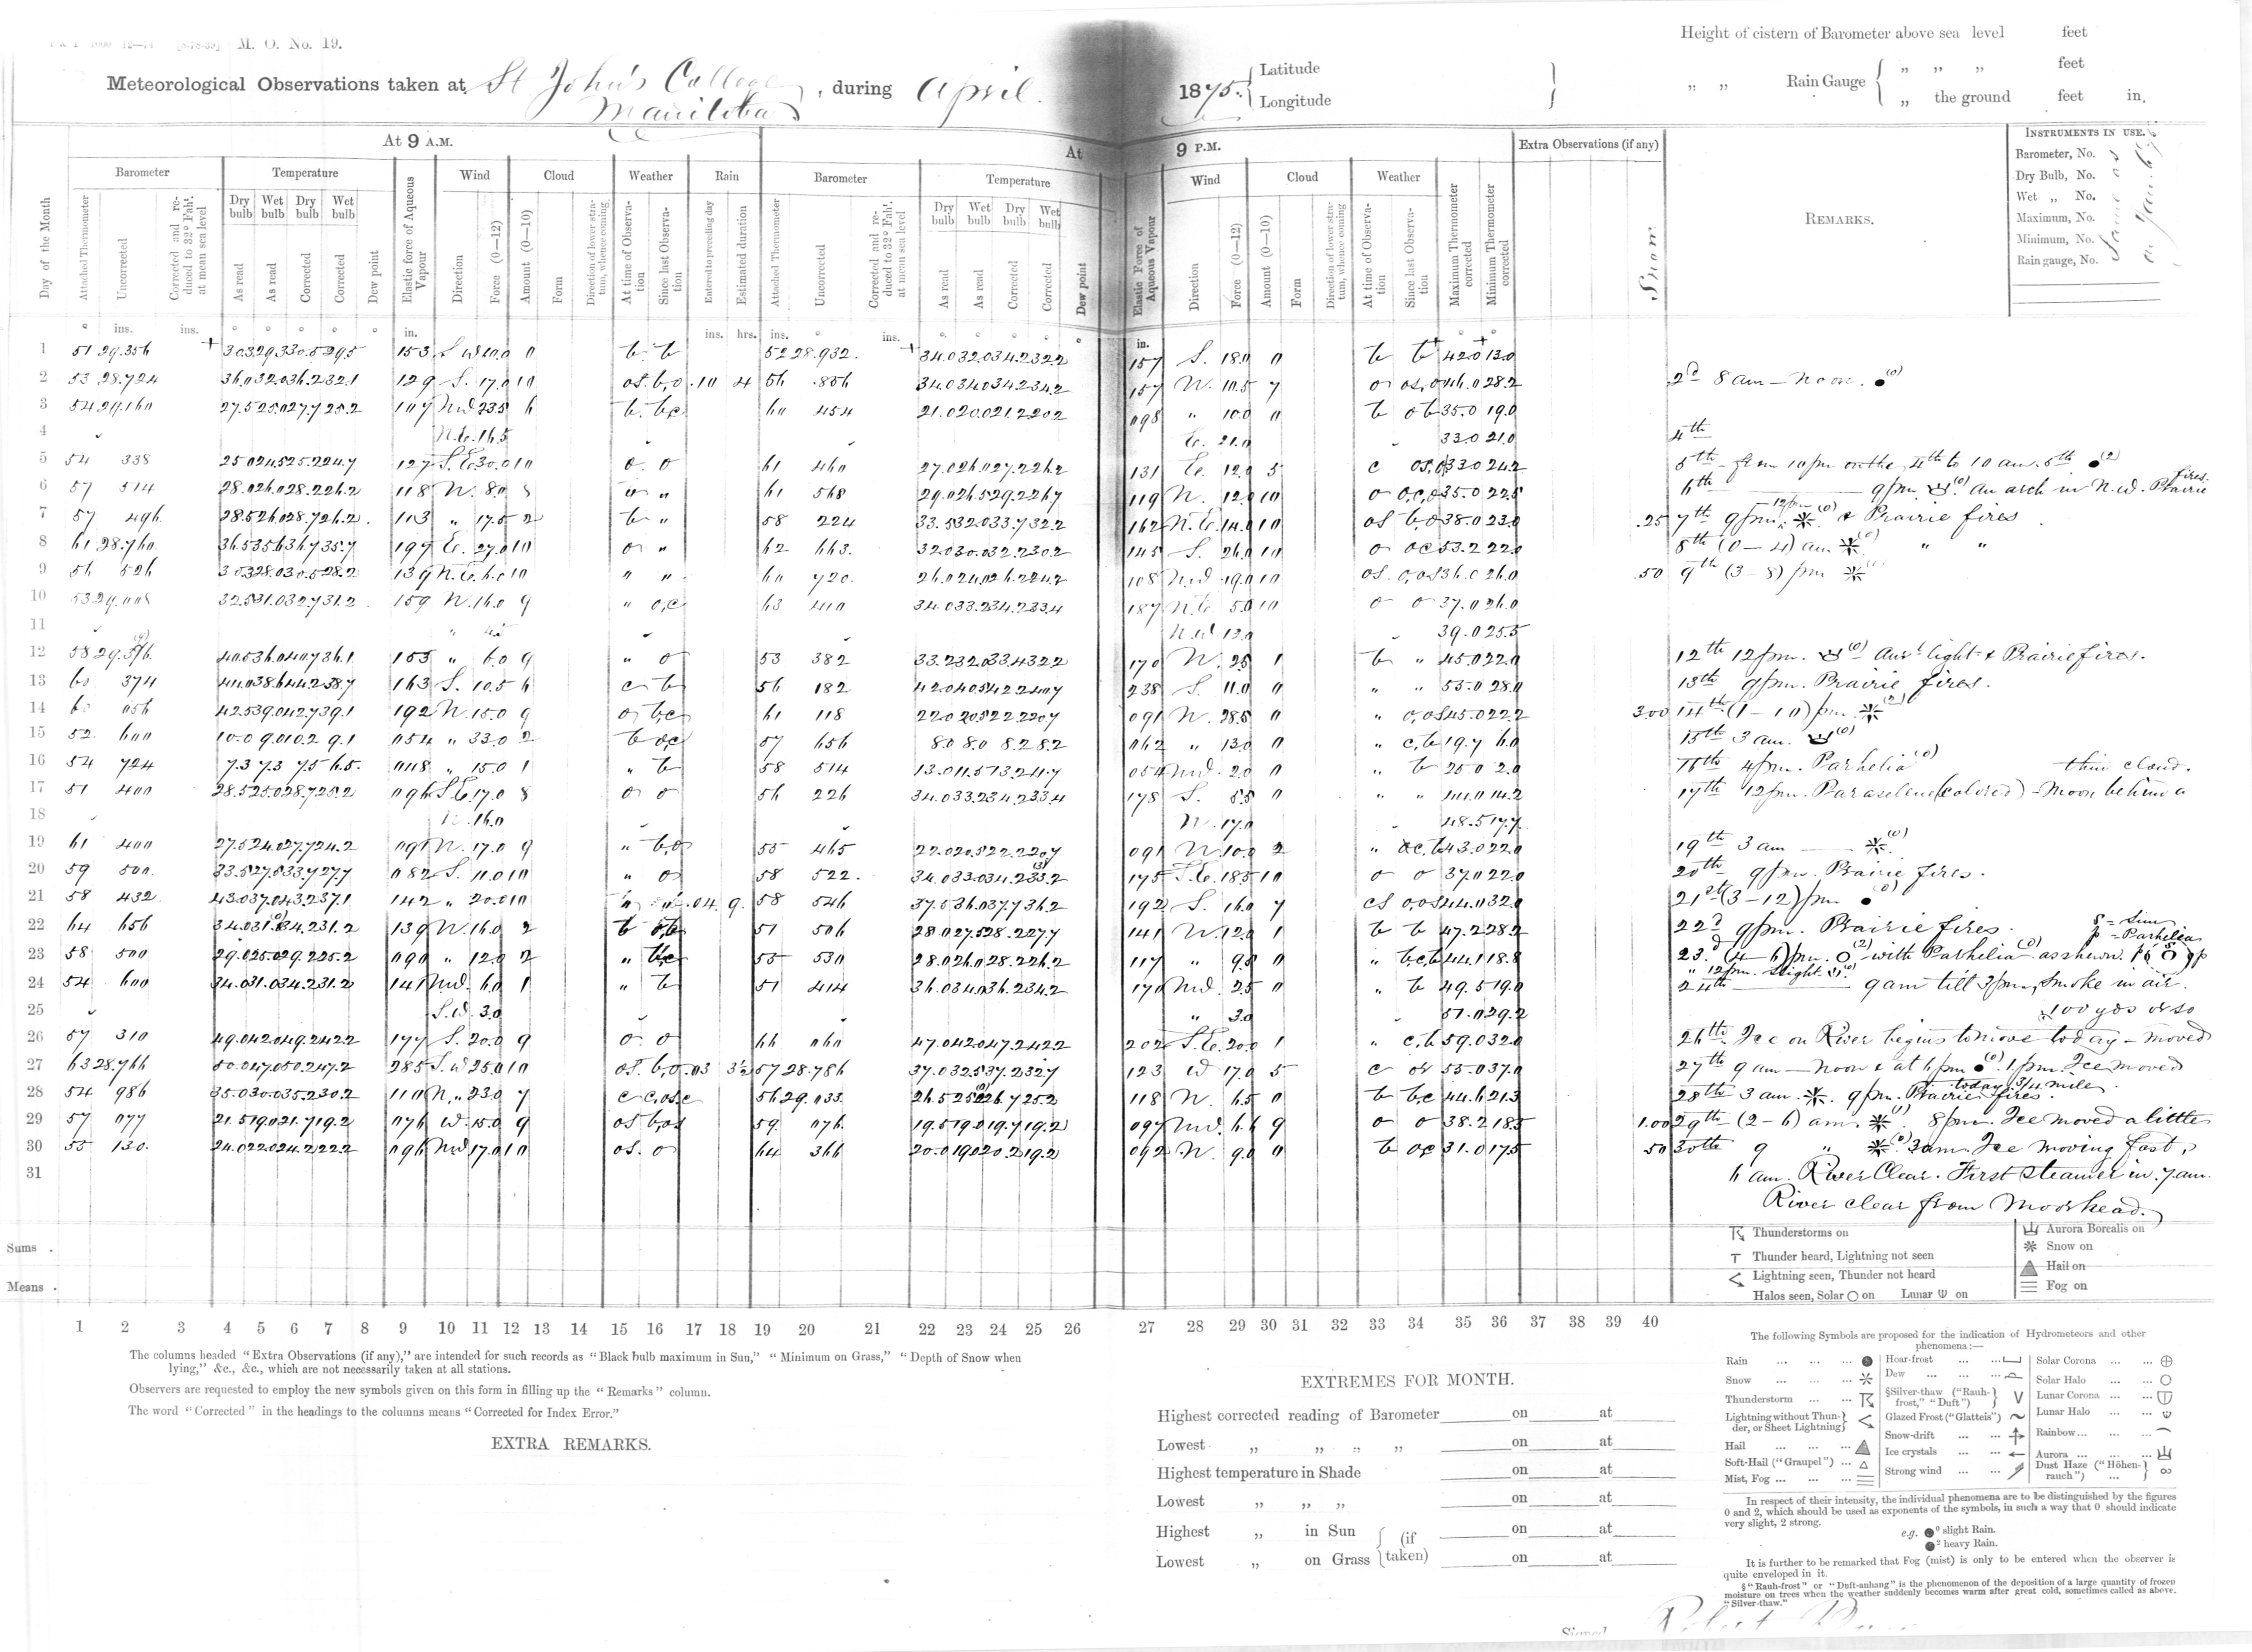
1875 - Based on the observer notes, there were some issues in the ECCC Archives. 2.5 mm of rain fell on the 2nd and snow was mistakenly entered as rain on the 29th and 30th. These changes resulted in a reduction in rainfall from 6.9 mm to 4.3 mm and in an increased snowfall from 15.2 cm to 20.3 cm. Further proof to these issues was seen in St Andrews which had rain on the 2nd and snow on the 29th-30th.
1999 - Approximately 7 to 9 mm of precipitation on April 3 fell in the form of ice pellets and was assumed to be snow at 10:1 ratio by ECCC. Therefore, this 7 to 9 cm of inferred snowfall is likely not true snowfall accumulation (true accumulation was likely substantially less given the typical very low ratios of ice pellets). This would make the true monthly snowfall amount somewhere between 37 cm and 46 cm.
2011 - Rainfall is considered estimated due to mixed precipitation on the 3rd, 15th and 16th. Accuracy is within a few mm.
2016 - Rainfall is considered estimated due to mixed precipitation on the 5th and 6th. Accuracy is within a few tenths of mm.
2022 - Suspected under-catch of snow in windy conditions at XWG on the 13th to 15th. The Forks used as replacement on these days, raising the monthly precipitation from 118.2 mm to 123.0 mm. Interesting to note that The Forks recorded 143.9 mm of precipitation, which would be the wettest April ever recorded in the city since 1872. It also recorded 113 mm of rain.
Graphs:
Rainfall:


