Top 30 Wettest DECEMBERS - WINNIPEG (since 1872)
|
Rank |
Rainfall
(mm) |
Snowfall
(cm) |
Precipitation
(mm) |
Rank |
|||
|
1 |
23.4 |
1877 |
101.3 |
1909 |
101.3 |
1909 |
1 |
|
2 |
22.2 |
1982 |
68.8 |
2016 |
51.8 |
1955 |
2 |
|
3 |
6.9 |
1941 |
50.8 |
1882 |
50.8 |
1882 |
3 |
|
4 |
6.4 |
1973 |
50.0 |
1955 |
50.4 |
2016
E |
4 |
|
5 |
5.8 |
1987 |
48.8 |
1874 |
48.8 |
1874 |
5 |
|
6 |
4.4 |
2020 |
48.3 |
1879 |
48.3 |
1879 |
6 |
|
7 |
4.3 |
1959 |
47.5 |
1910 |
47.5 |
1910 |
7 |
|
8 |
4.1 |
1939 |
47.0 |
1947 |
47.0 |
1947 |
8 |
|
9 |
3.6 |
1999 |
46.2 |
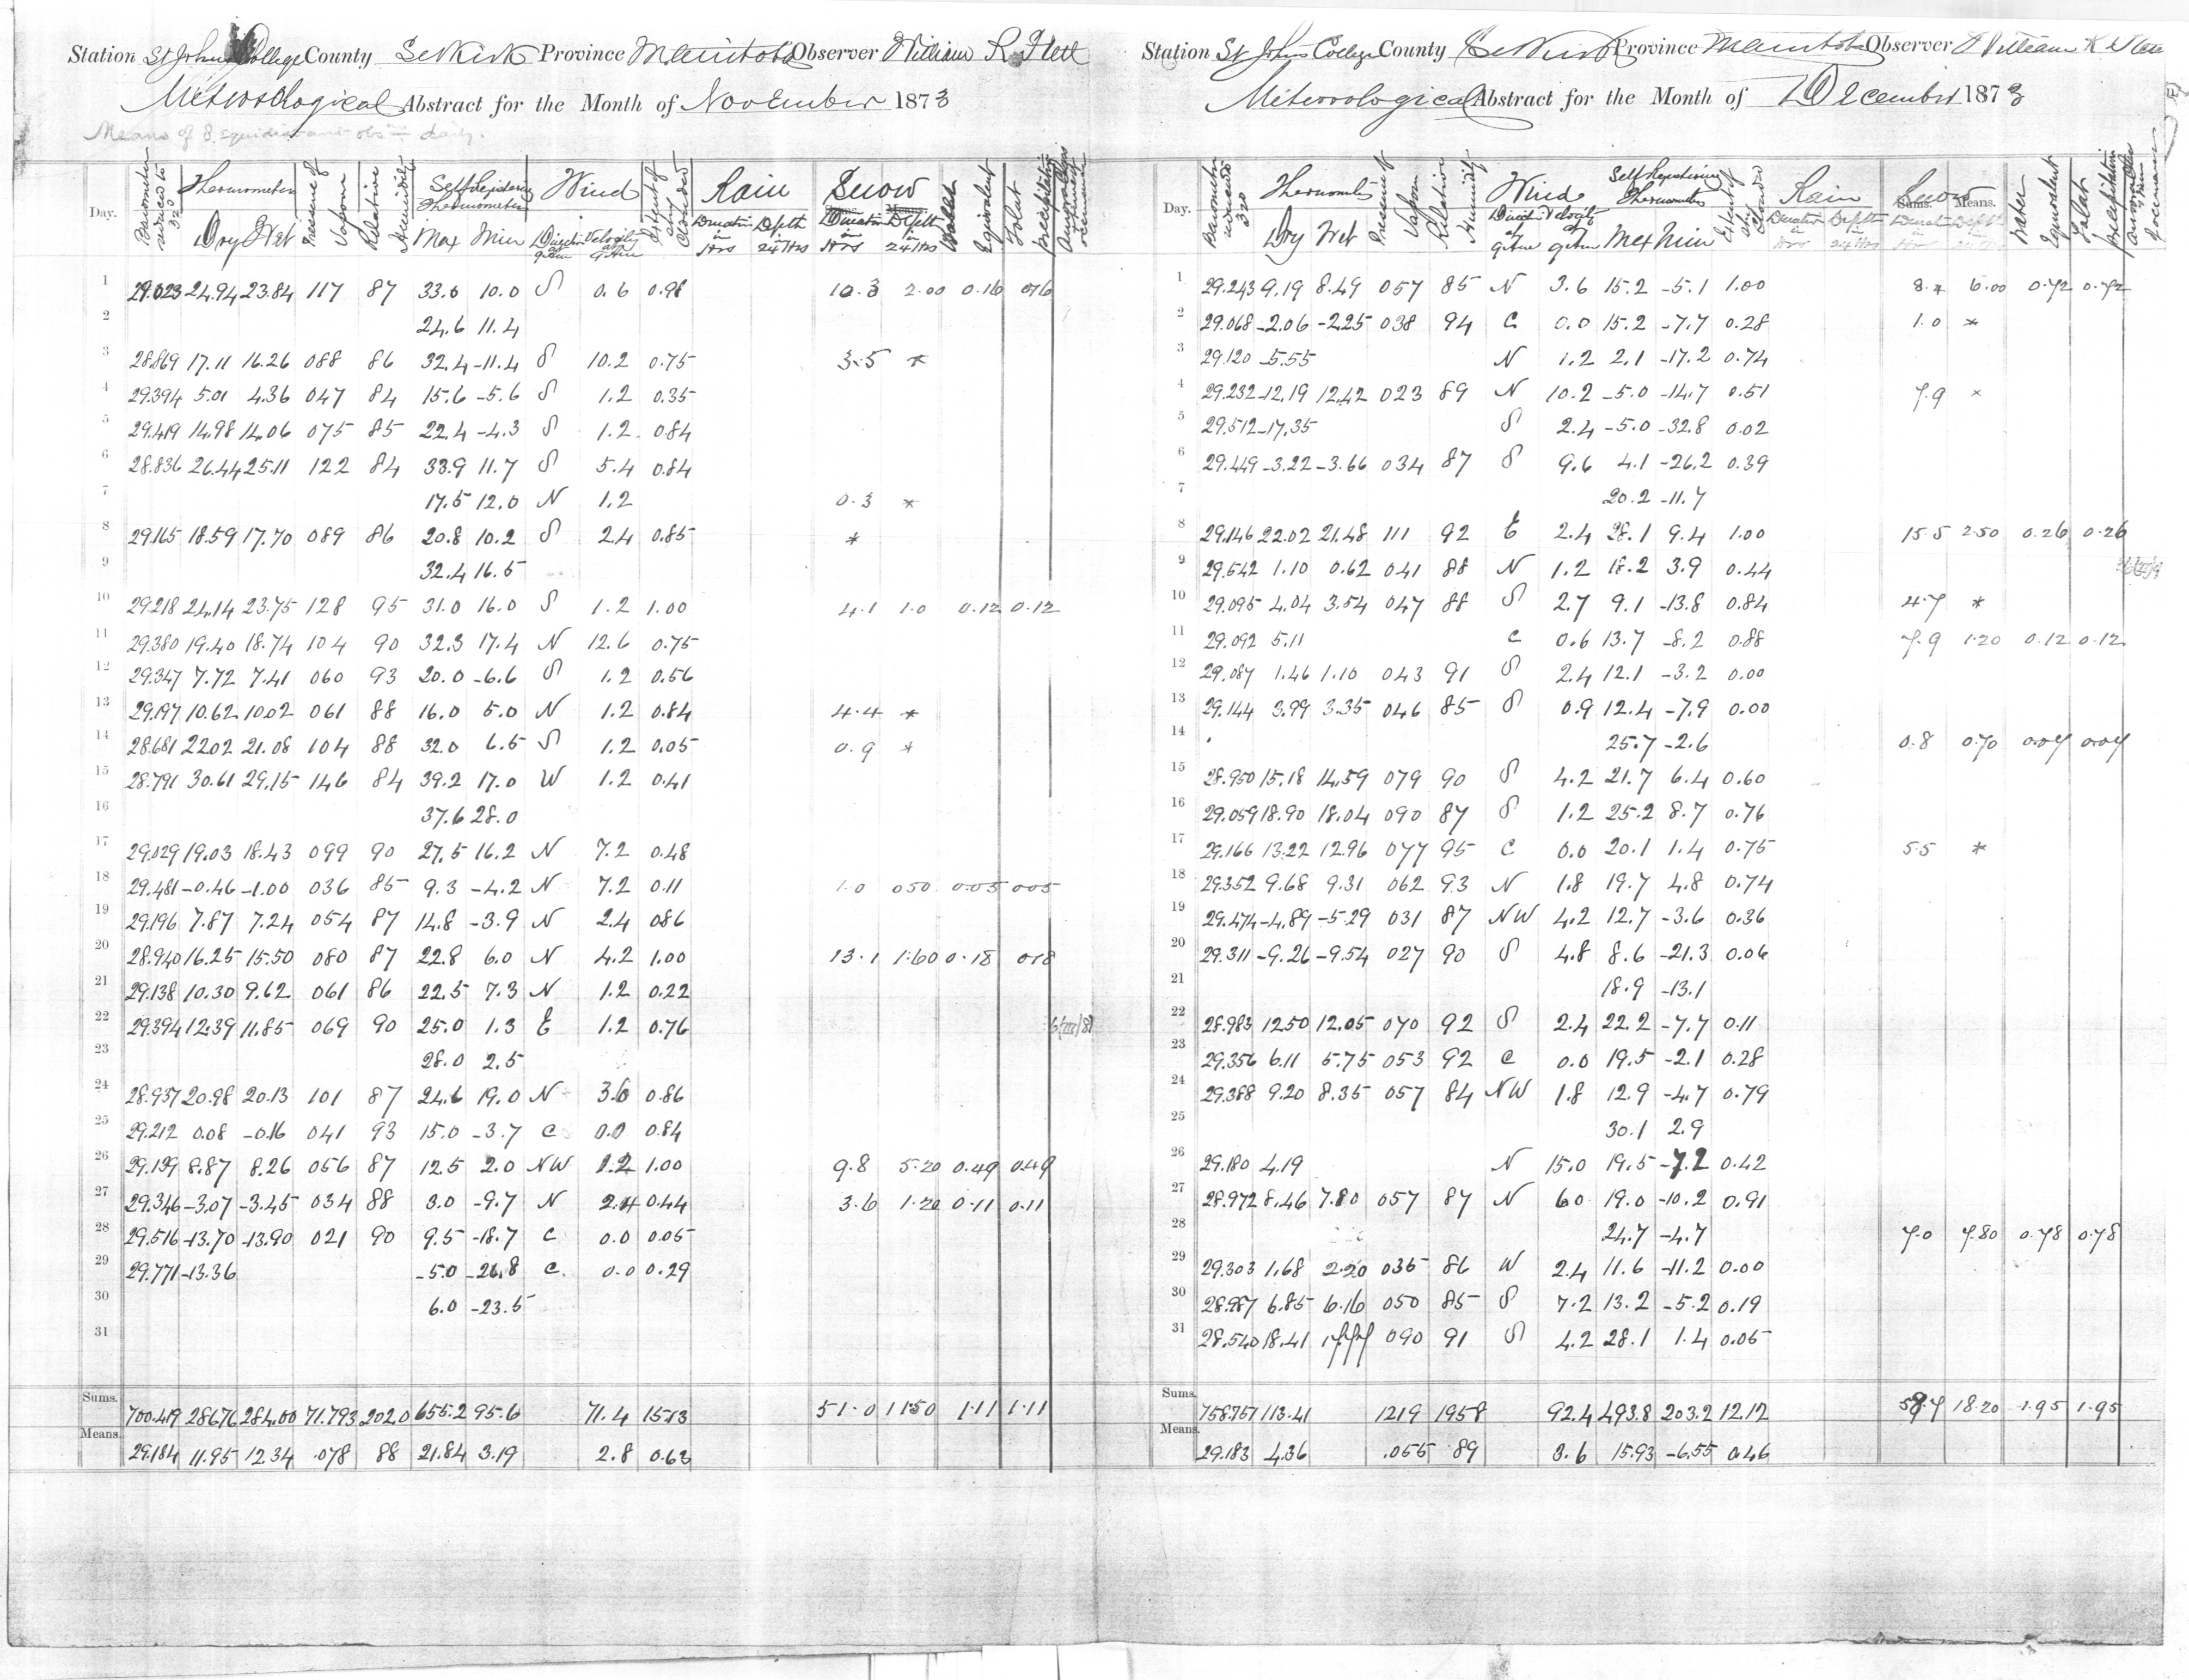
1873 |
46.2 |
1873 |
9 |
|
10 |
3.0 |
2003
E |
45.8 |
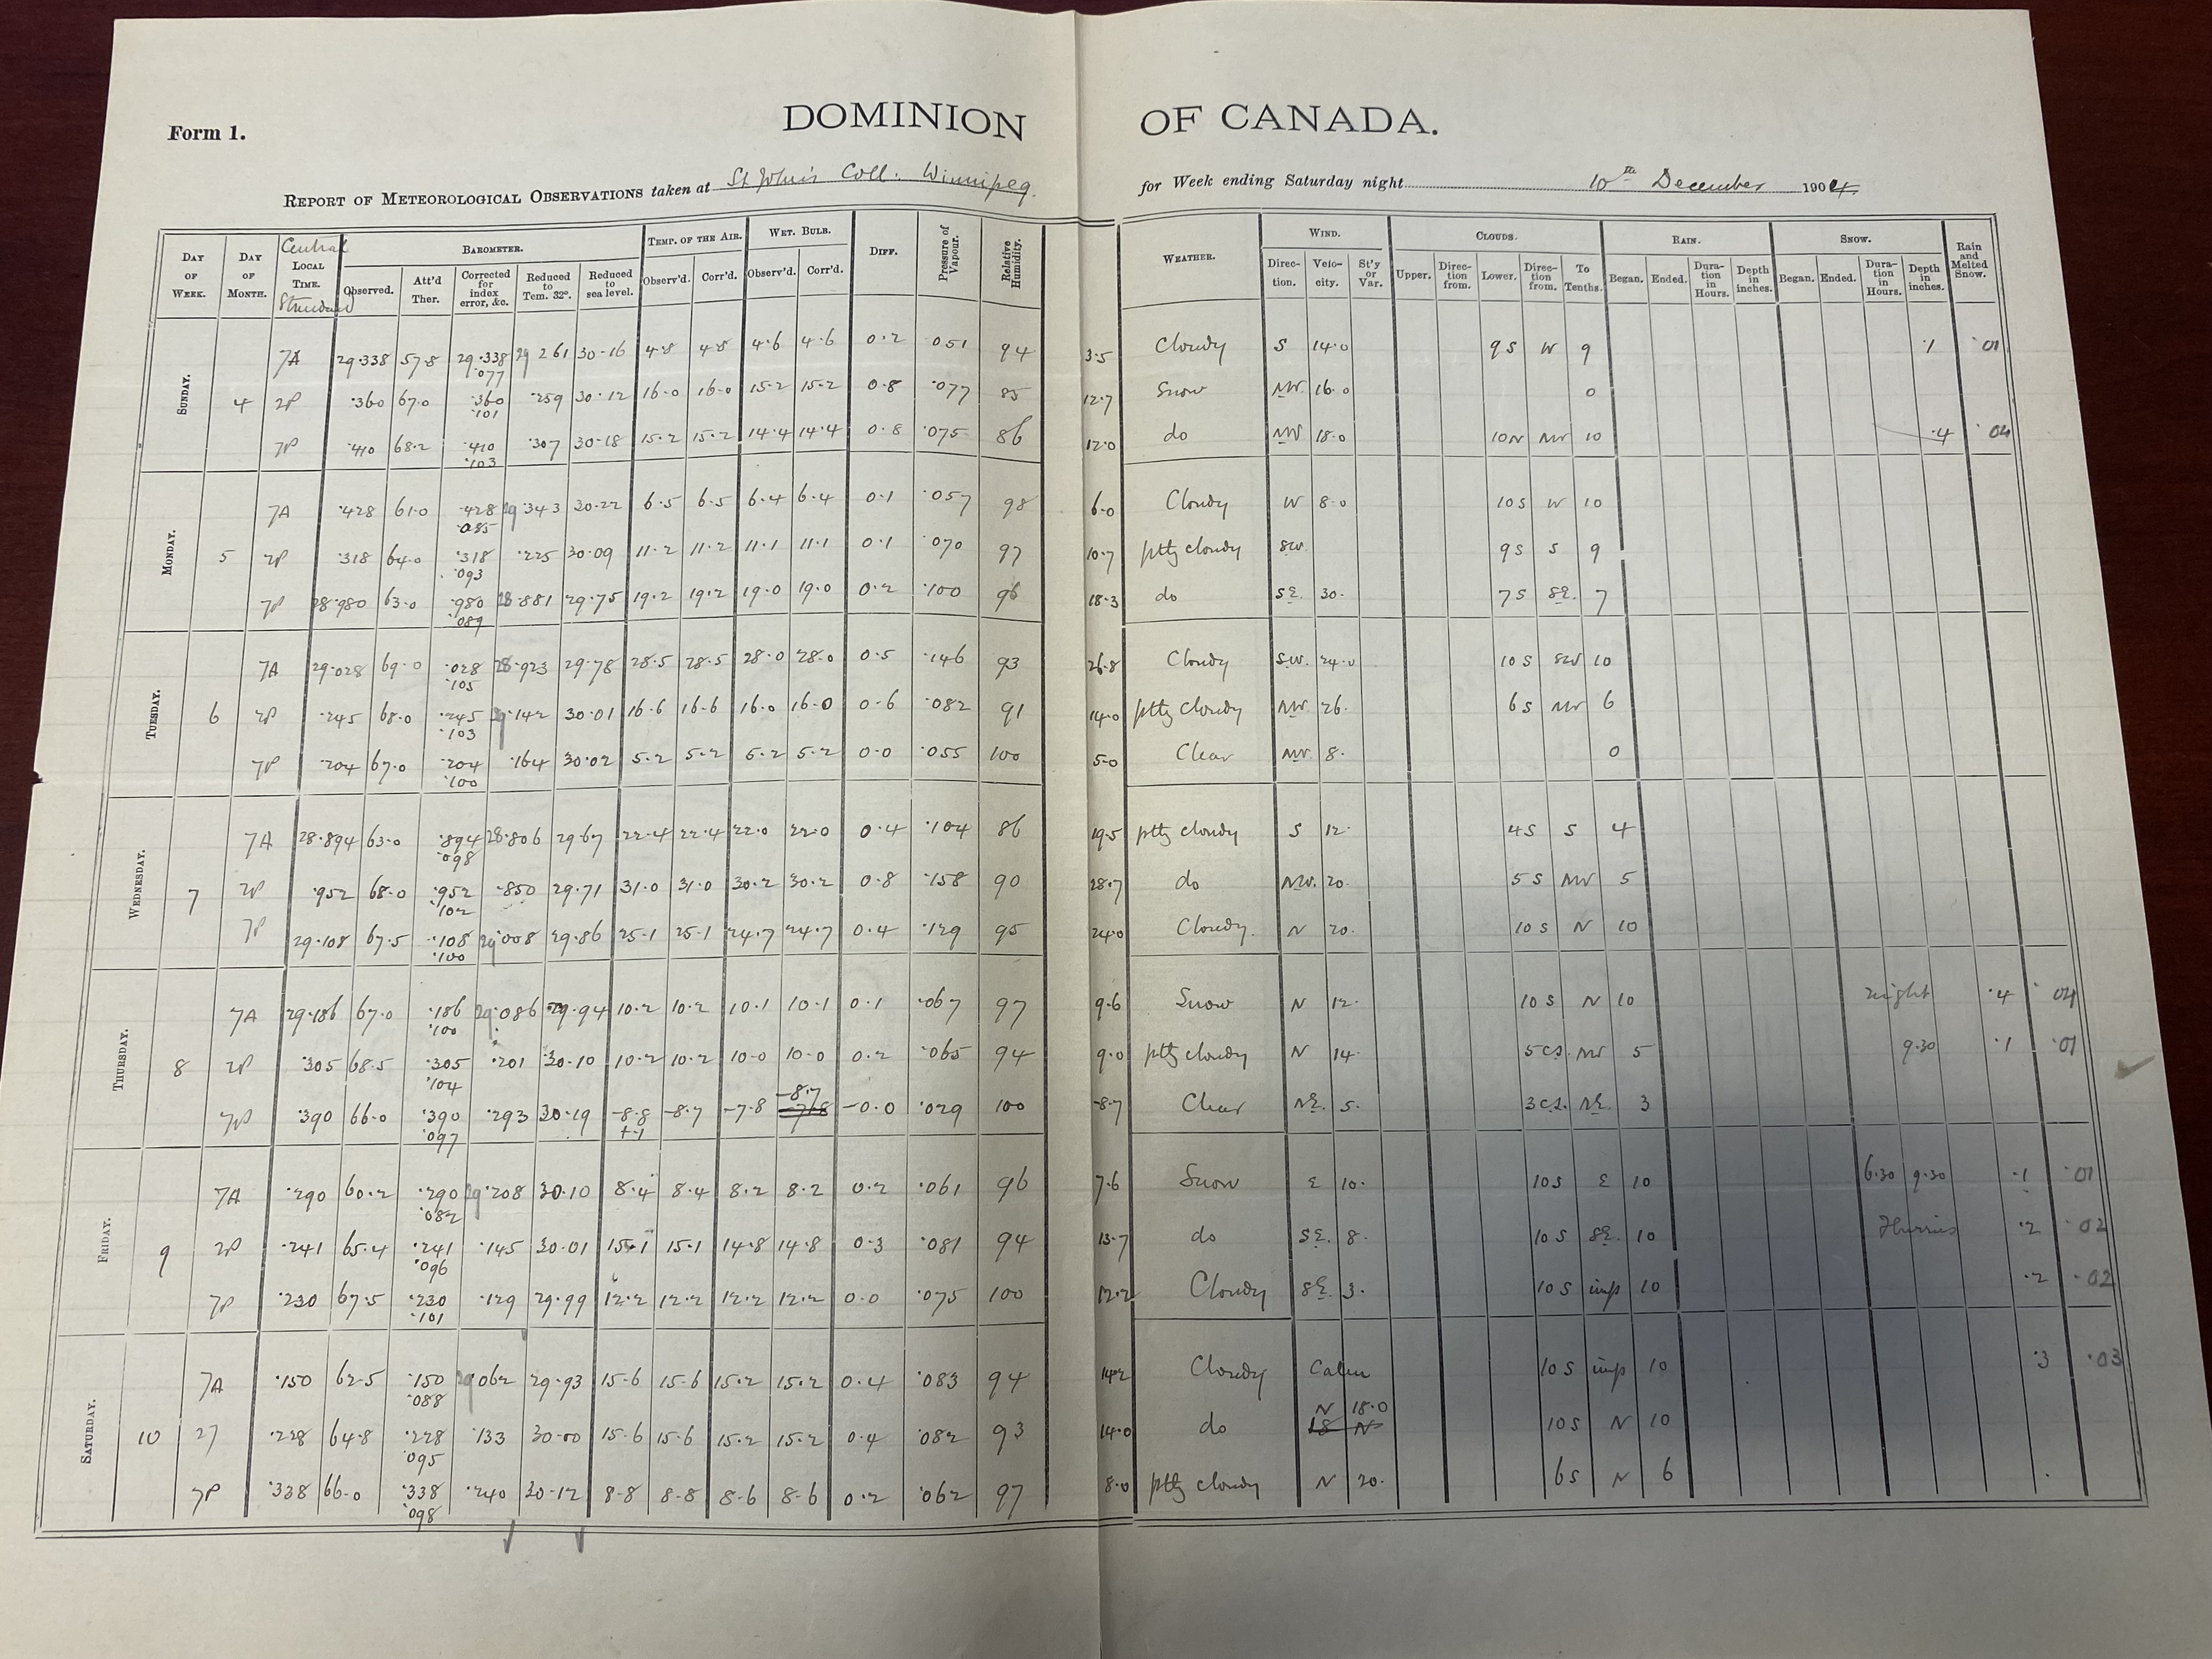
2004 |
44.5 |
1895 |
10 |
|
11 |
2.8 |
1980 |
45.5 |
1964 |
43.2 |
1916 |
11 |
|
12 |
2.5 |
1967 |
44.7 |
1965 |
42.9 |
1915 |
12 |
|
13 |
2.5 |
1970 |
44.0 |
2015 |
41.9 |
1904 |
13 |
|
14 |
2.5 |
2012 |
43.2 |
1895 |
41.4 |
1948 |
14 |
|
15 |
2.0 |
1891 |
43.2 |
1916 |
40.9 |
1949 |
15 |
|
16 |
2.0 |
1896 |
42.8 |
1996 |
40.4 |
2004
E |
16 |
|
17 |
1.9 |
2004 E |
42.7 |
1915 |
40.2 |
1996 |
17 |
|
18 |
1.8 |
1951 |
41.9 |
1904
Z |
39.9 |
1933 |
18 |
|
19 |
1.8 |
1955 |
41.6 |
2007 |
38.4 |
1956 |
19 |
|
20 |
1.8 |
2023 |
41.3 |
2000 |
38.4 |
1965 |
20 |
|
21 |
1.6 |
1977 |
40.6 |
1948 |
38.1 |
1902 |
21 |
|
22 |
1.5 |
1894 |
40.0 |
2013 |
36.8 |
1929 |
22 |
|
23 |
1.5 |
2005 |
39.9 |
1933 |
36.0 |
2006 |
23 |
|
24 |
1.4 |
2001 |
39.6 |
1949 |
35.6 |
1914 |
24 |
|
25 |
1.4 |
2018 E |
38.6 |
1992 |
35.3 |
1922 |
25 |
|
26 |
1.3 |
1892 |
38.4 |
1956 |
35.1 |
1889 |
26 |
|
27 |
1.3 |
1895 |
38.1 |
1902 |
34.8 |
1887 |
27 |
|
28 |
1.3 |
1949 |
37.4 |
2021 |
34.8 |
1937 |
28 |
|
29 |
1.0 |
1925 |
36.8 |
2006 |
34.3 |
1942 |
29 |
|
30 |
1.0 |
1931 |
36.3 |
1929 |
33.3 |
1918 |
30 |
1873 - Missing data on the 4th was filled in using the observer notes which showed only a trace of snow.
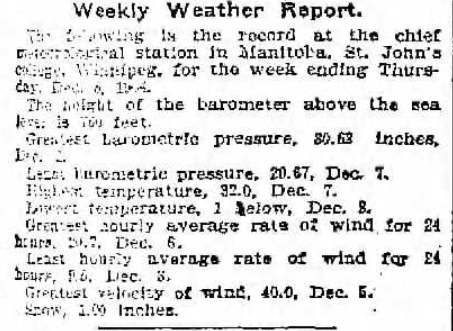
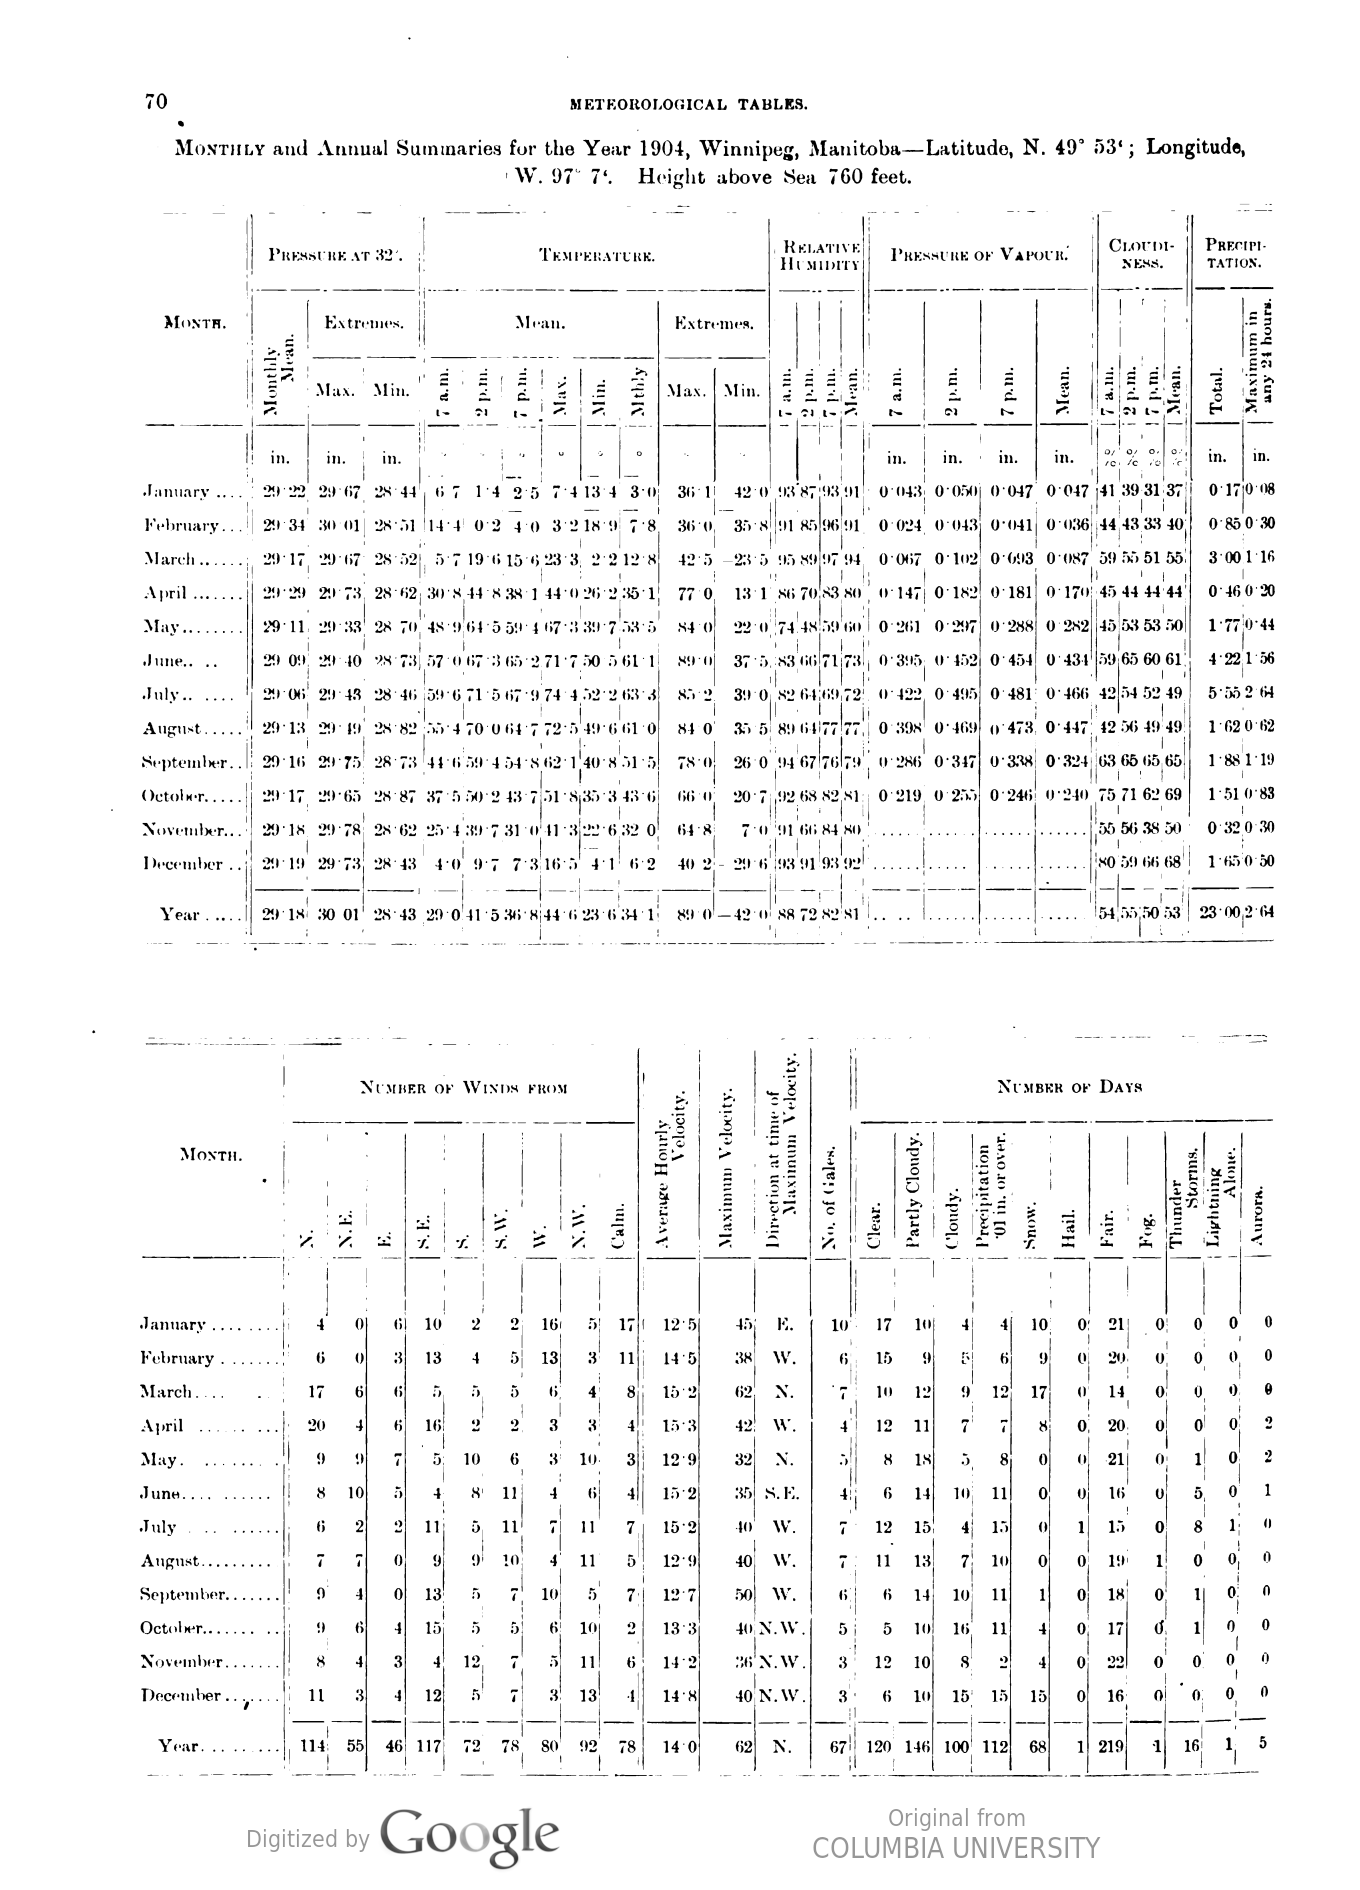
1904 - Contradictory info exists about the snowfall of Dec 4, 1904. St John's College observer notes show 1.3 cm (0.5 in). A weekly summary by the Free Press also suggests only 1.3 cm (0.5 in) on Dec 4. ECCC has 12.7 cm. I have chosen to not change the value, however, because a government publication from 1905 showed the same snow amount as the ECCC archives for December, suggesting the 12.7 cm on Dec 4 is potentially correct. Note that Stony Mountain and Oakbank only recorded a trace on Dec 4. I am leaning toward the 12.7 cm being erroneous, however, I feel I need more evidence to confirm it.
2003 - All precip was erroneously assumed to be snow when there was in fact accumulative rain on at least the 27th. It is difficult to say exactly how much rain fell however, especially with CXWG being missing. I have used Charleswood's 3.0 mm of rain as a guesstimate.
2004 - Issues this month with rain being entered in as snow mistakenly. All the 2.5 mm of precip on the 3rd was in fact rain, not snow. However, this appears to be unrealistically high, perhaps due to nipher shield issues. I am using The Forks 1.4 mm for this date as a result (for both precip and rain), which is more in line with Charleswood 1.0 mm. On the 11th, 0.5 mm of rain/freezing rain is assumed (difficult to say for sure given mixed precip types). This gives 1.9 mm of rain and 40.4 mm of precip for the month. Original rain amount trace and original precip amount 42.0 mm.
2016 - XWG suffered from severe under-catch of snow. Being one of the snowiest Decembers on record thanks to two Colorado Lows, it didn't make sense that there would be below normal precip as suggested by XWG (14.4 mm, or 17.8 mm with the 6th filled in). Unfortunately, The Forks suffered from frequent spurious precipitation (total 64.0 mm). As a result, I had no choice but to use Charleswood's precip amounts for the month (50.4 mm), retrievable in Cocorahs via station CAN-MB-206.
2018 - Rainfall on the 19th is estimated due to mixed preicipitation.
Graphs:
Rainfall:


