Top 30 Driest SUMMERS - WINNIPEG (since 1873)
|
Rank |
Rainfall
(mm) |
Snowfall
(cm) |
Precipitation
(mm) |
Rank |
|||
|
1 |
76.7 |
1929 |
0.0 |
|
76.7 |
1929 |
1 |
|
2 |
91.0 |
1961 |
|
|
91.0 |
1961 |
2 |
|
3 |
91.5 |
2006 |
|
|
91.5 |
2006 |
3 |
|
4 |
92.0 |
2011
E |
|
|
92.0 |
2011
E |
4 |
|
5 |
93.7 |
1886 C |
|
|
93.7 |
1886 C |
5 |
|
6 |
96.0 |
1889 |
|
|
96.0 |
1889 |
6 |
|
7 |
97.1 |
1894 |
|
|
97.1 |
1894 |
7 |
|
8 |
104.6 |
1881
E |
|
|
104.6 |
1881
E |
8 |
|
9 |
114.8 |
1915 |
|
|
114.8 |
1915 |
9 |
|
10 |
121.4 |
1936 |
|
|
121.4 |
1936 |
10 |
|
11 |
128.5 |
2012 E |
|
|
128.5 |
2012 E |
11 |
|
12 |
130.6 |
1978 |
|
|
130.6 |
1978 |
12 |
|
13 |
133.5 |
2018 E |
|
|
133.5 |
2018 E |
13 |
|
14 |
135.2 |
1910 |
|
|
135.2 |
1910 |
14 |
|
15 |
136.6 |
2017 E |
|
|
136.6 |
2017 E |
15 |
|
16 |
139.4 |
1924 |
|
|
139.4 |
1924 |
16 |
|
17 |
140.7 |
1903 |
|
|
140.7 |
1903 |
17 |
|
18 |
144.0 |
1923 |
|
|
144.0 |
1923 |
18 |
|
19 |
145.3 |
1902 |
|
|
145.3 |
1902 |
19 |
|
20 |
146.9 |
1927 |
|
|
146.9 |
1927 |
20 |
|
21 |
148.9 |
1920 |
|
|
148.9 |
1920 |
21 |
|
22 |
150.9 |
1960 |
|
|
150.9 |
1960 |
22 |
|
23 |
151.6 |
1925 |
|
|
151.6 |
1925 |
23 |
|
24 |
157.7 |
1933 |
|
|
157.7 |
1933 |
24 |
|
25 |
158.2 |
1931 |
|
|
158.2 |
1931 |
25 |
|
26 |
159.0 |
1946 |
|
|
159.0 |
1946 |
26 |
|
27 |
159.5 |
1974 |
|
|
159.5 |
1974 |
27 |
|
28 |
163.8 |
1887 |
|
|
163.8 |
1887 |
28 |
|
29 |
164.3 |
1979 |
|
|
164.3 |
1979 |
29 |
|
30 |
165.5 |
2003
E |
|
|
165.5 |
2003
E |
30 |
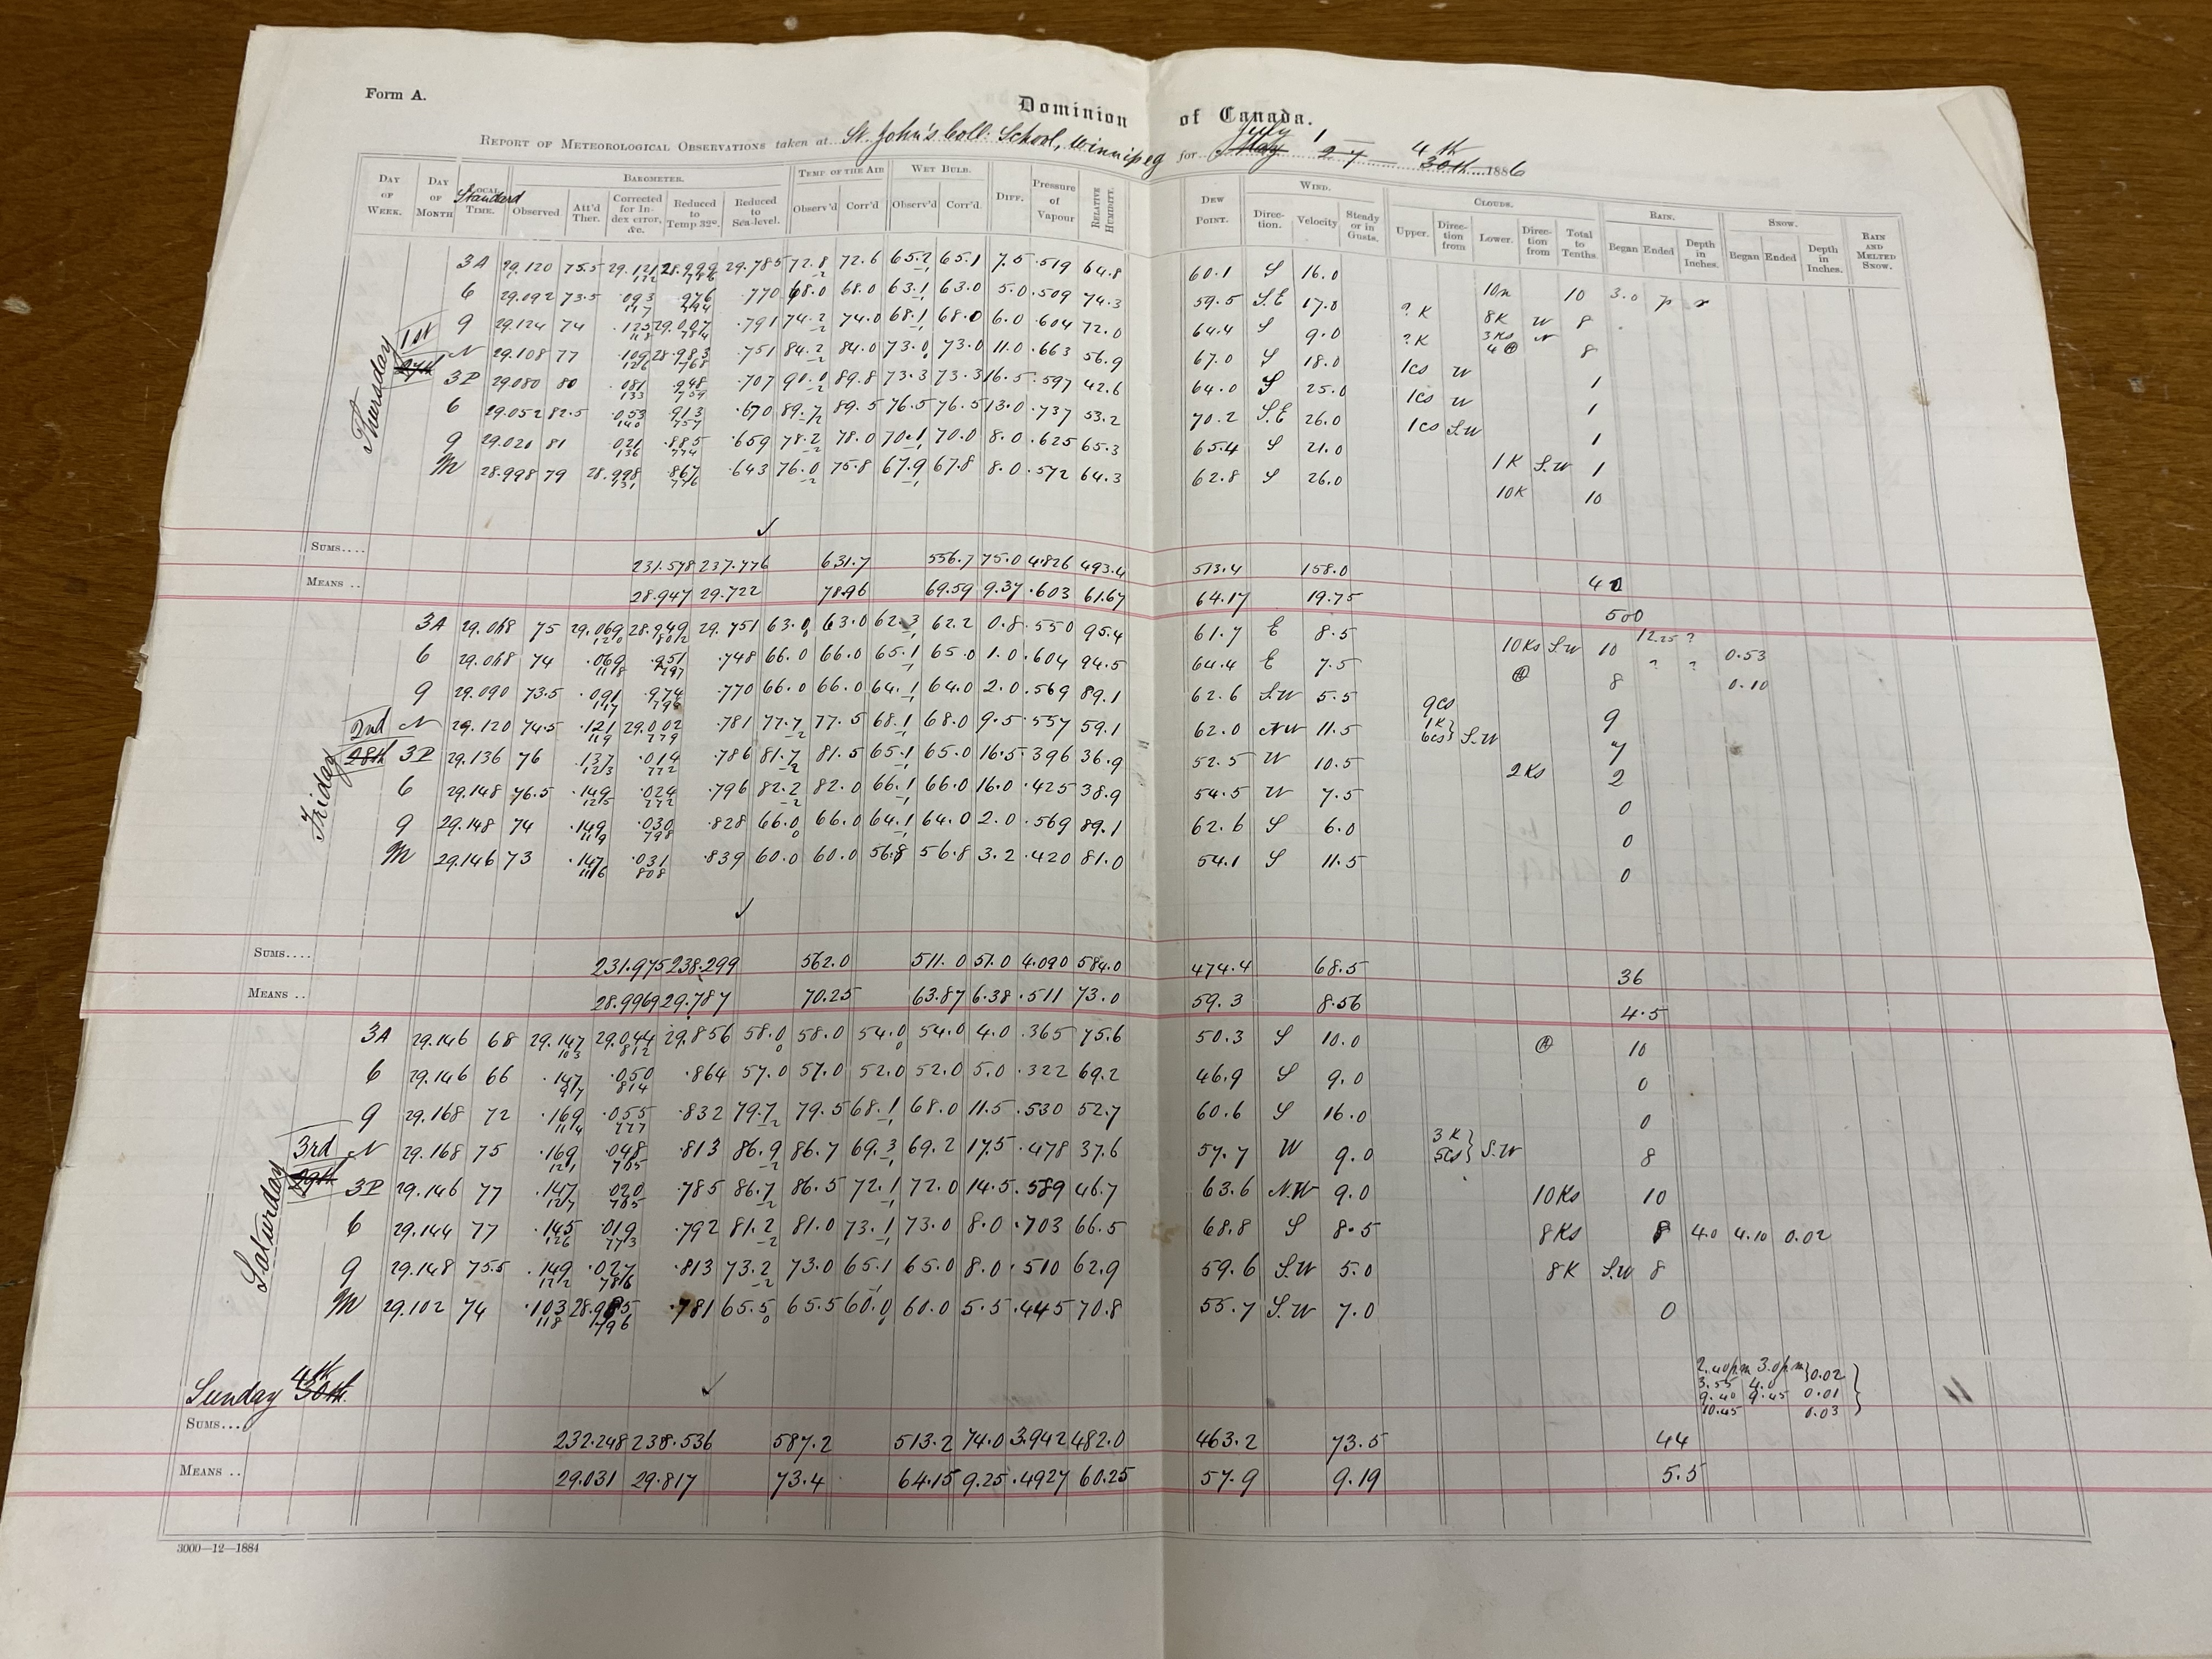
1886 - Observer notes from St John's College (from Library and Archives of Canada in Winnipeg) and Monthly Weather Review (Government publication) show about 34 mm of rainfall in July. The difference from the Archives (17 mm) is because of differences in the July 1st to 4th period. 18 mm of rain fell according to the two sources, while the ECCC Archives only have 1.6 mm, which is clearly erroneous. Not sure where the error originated.
Graphs:
Rainfall:

