OCTOBER Daily Precipitation Records - WINNIPEG (since 1872)
|
Day |
High rainfall |
High
snowfall |
High Precip |
Day |
|||
|
1 |
23.1 |
1926 |
4.0 |
1996 |
23.1 |
1926 |
1 |
|
2 |
50.5 |
1898 |
12.7 |
1950 |
50.5 |
1898 |
2 |
|
3 |
36.2 |
2023 |
4.4 |
2018 |
36.2 |
2023 |
3 |
|
4 |
23.4 |
1926 |
8.6 |
1952 |
23.4 |
1926 |
4 |
|
5 |
30.7 |
1924 |
11.4 |
1876 |
30.7 |
1924 |
5 |
|
6 |
43.3 |
1994 |
1.5 |
1974 |
43.3 |
1994 |
6 |
|
7 |
22.1 |
1882 |
3.8 |
1985 |
22.1 |
1882 |
7 |
|
8 |
19.8 |
1890 |
10.0 |
1985 |
19.8 |
1890 |
8 |
|
9 |
28.7 |
1924 |
10.0 |
2009 |
28.7 |
1924 |
9 |
|
10 |
74.4 |
1949 |
21.0 |
2019 |
74.4 |
1949 |
10 |
|
11 |
24.1 |
1930 |
13.0 |
2019 |
24.1 |
1930 |
11 |
|
12 |
24.5 |
2008 |
3.6 |
1881 |
24.5 |
2008 |
12 |
|
13 |
28.4 |
1890 |
3.8 |
1876 |
28.4 |
1890 |
13 |
|
14 |
29.7 |
1975 |
1.5 |
1952 |
30.0 |
1975 |
14 |
|
15 |
37.0 |
1984 |
3.0 |
1922 |
37.0 |
1984 |
15 |
|
16 |
16.0 |
1882 |
20.3 |
1878 |
33.0 |
1878 |
16 |
|
17 |
22.9 |
1883 |
11.4 |
1926 |
22.9 |
1883 |
17 |
|
18 |
28.7 |
1949 |
12.7 |
1888 |
31.8 |
1888 |
18 |
|
19 |
21.2 |
1984 |
13.2 |
1888 |
21.2 |
1984 |
19 |
|
20 |
11.2 |
1886 |
13.2 |
1949 |
13.5 |
1949 |
20 |
|
21 |
19.3 |
1963 |
6.4 |
1917 |
19.3 |
1963 |
21 |
|
22 |
6.1 |
1958 |
13.5 |
1919 |
13.5 |
1919 |
22 |
|
23 |
14.4 |
2016 |
12.7 |
1873 |
14.4 |
2016 |
23 |
|
24 |
33.5 |
2022 |
7.1 |
1954 |
33.5 |
2022 |
24 |
|
25 |
19.6 |
1902 |
16.5 |
1875 |
19.6 |
1902 |
25 |
|
26 |
24.5 |
2010 |
7.9 |
1925 |
24.5 |
2010 |
26 |
|
27 |
18.8 |
1940 |
13.2 |
2003 |
18.8 |
1940 |
27 |
|
28 |
38.7 |
1991 |
9.7 |
1941 |
40.7 |
1991 |
28 |
|
29 |
17.8 |
1960 |
13.7 |
1912 |
17.8 |
1960 |
29 |
|
30 |
33.5 |
1927 |
24.6 |
1971 |
33.5 |
1927 |
30 |
|
31 |
15.8 |
2016 |
15.7 |
1919 |
15.8 |
2016 |
31 |
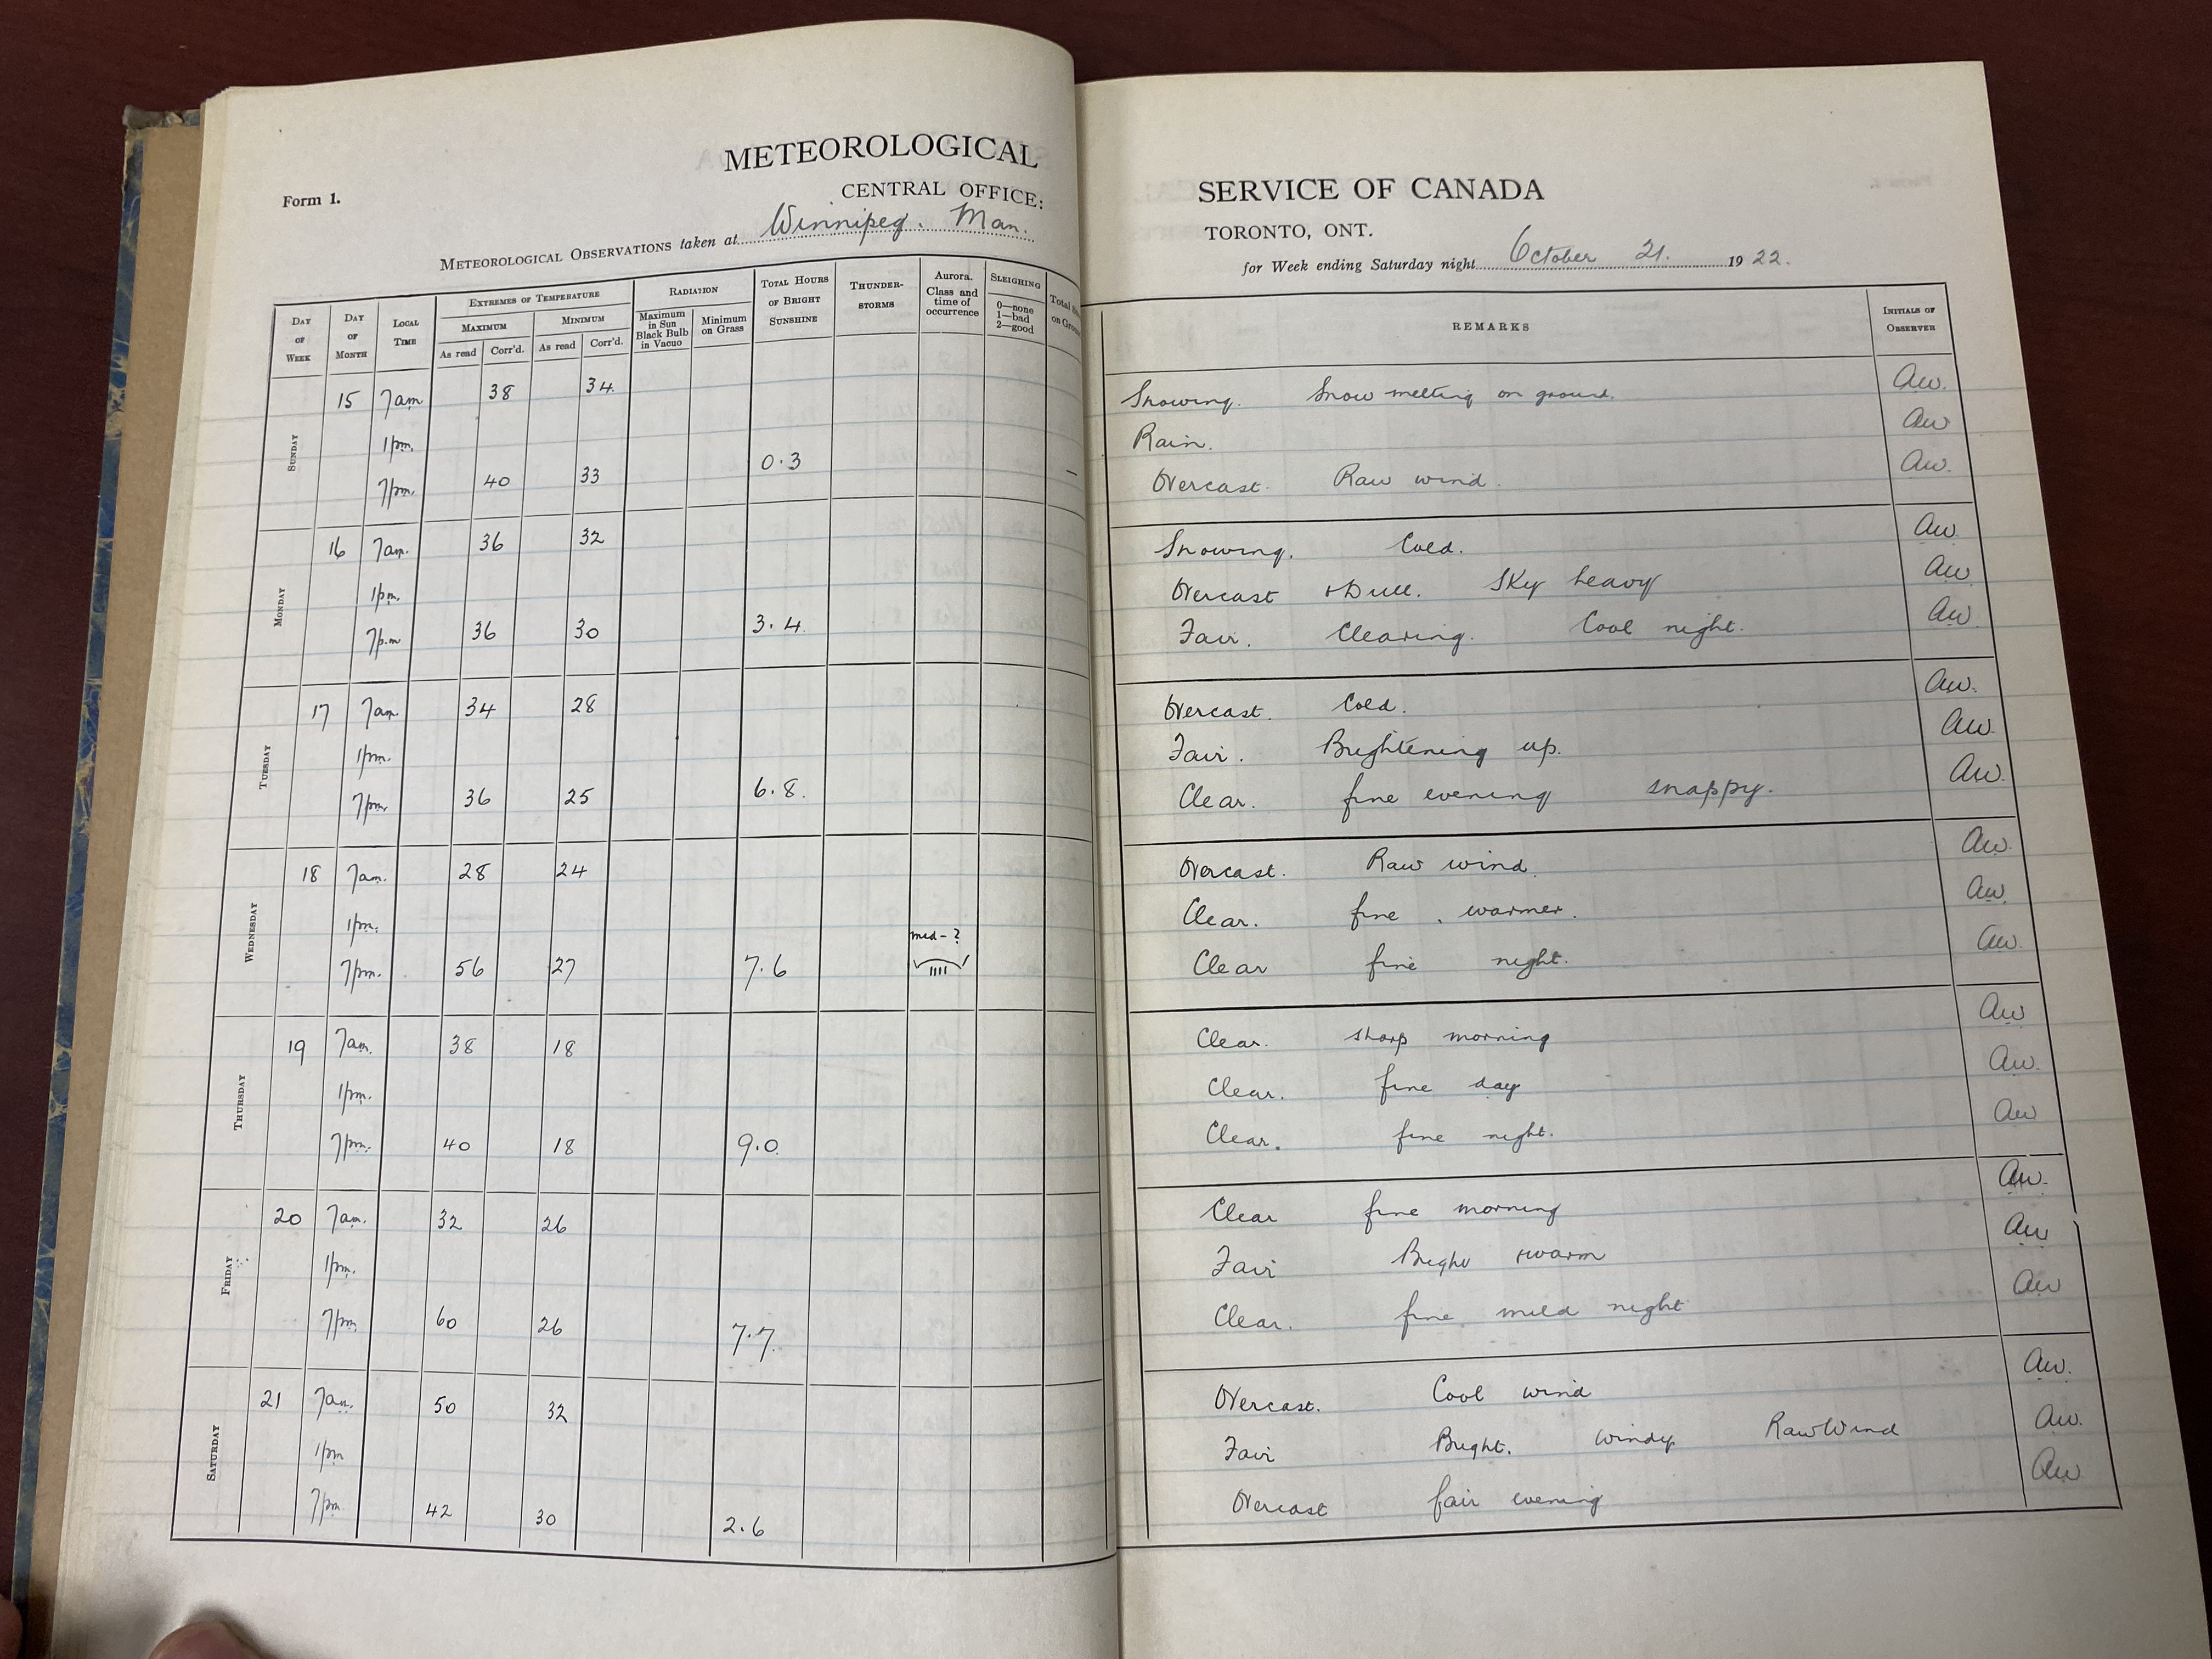
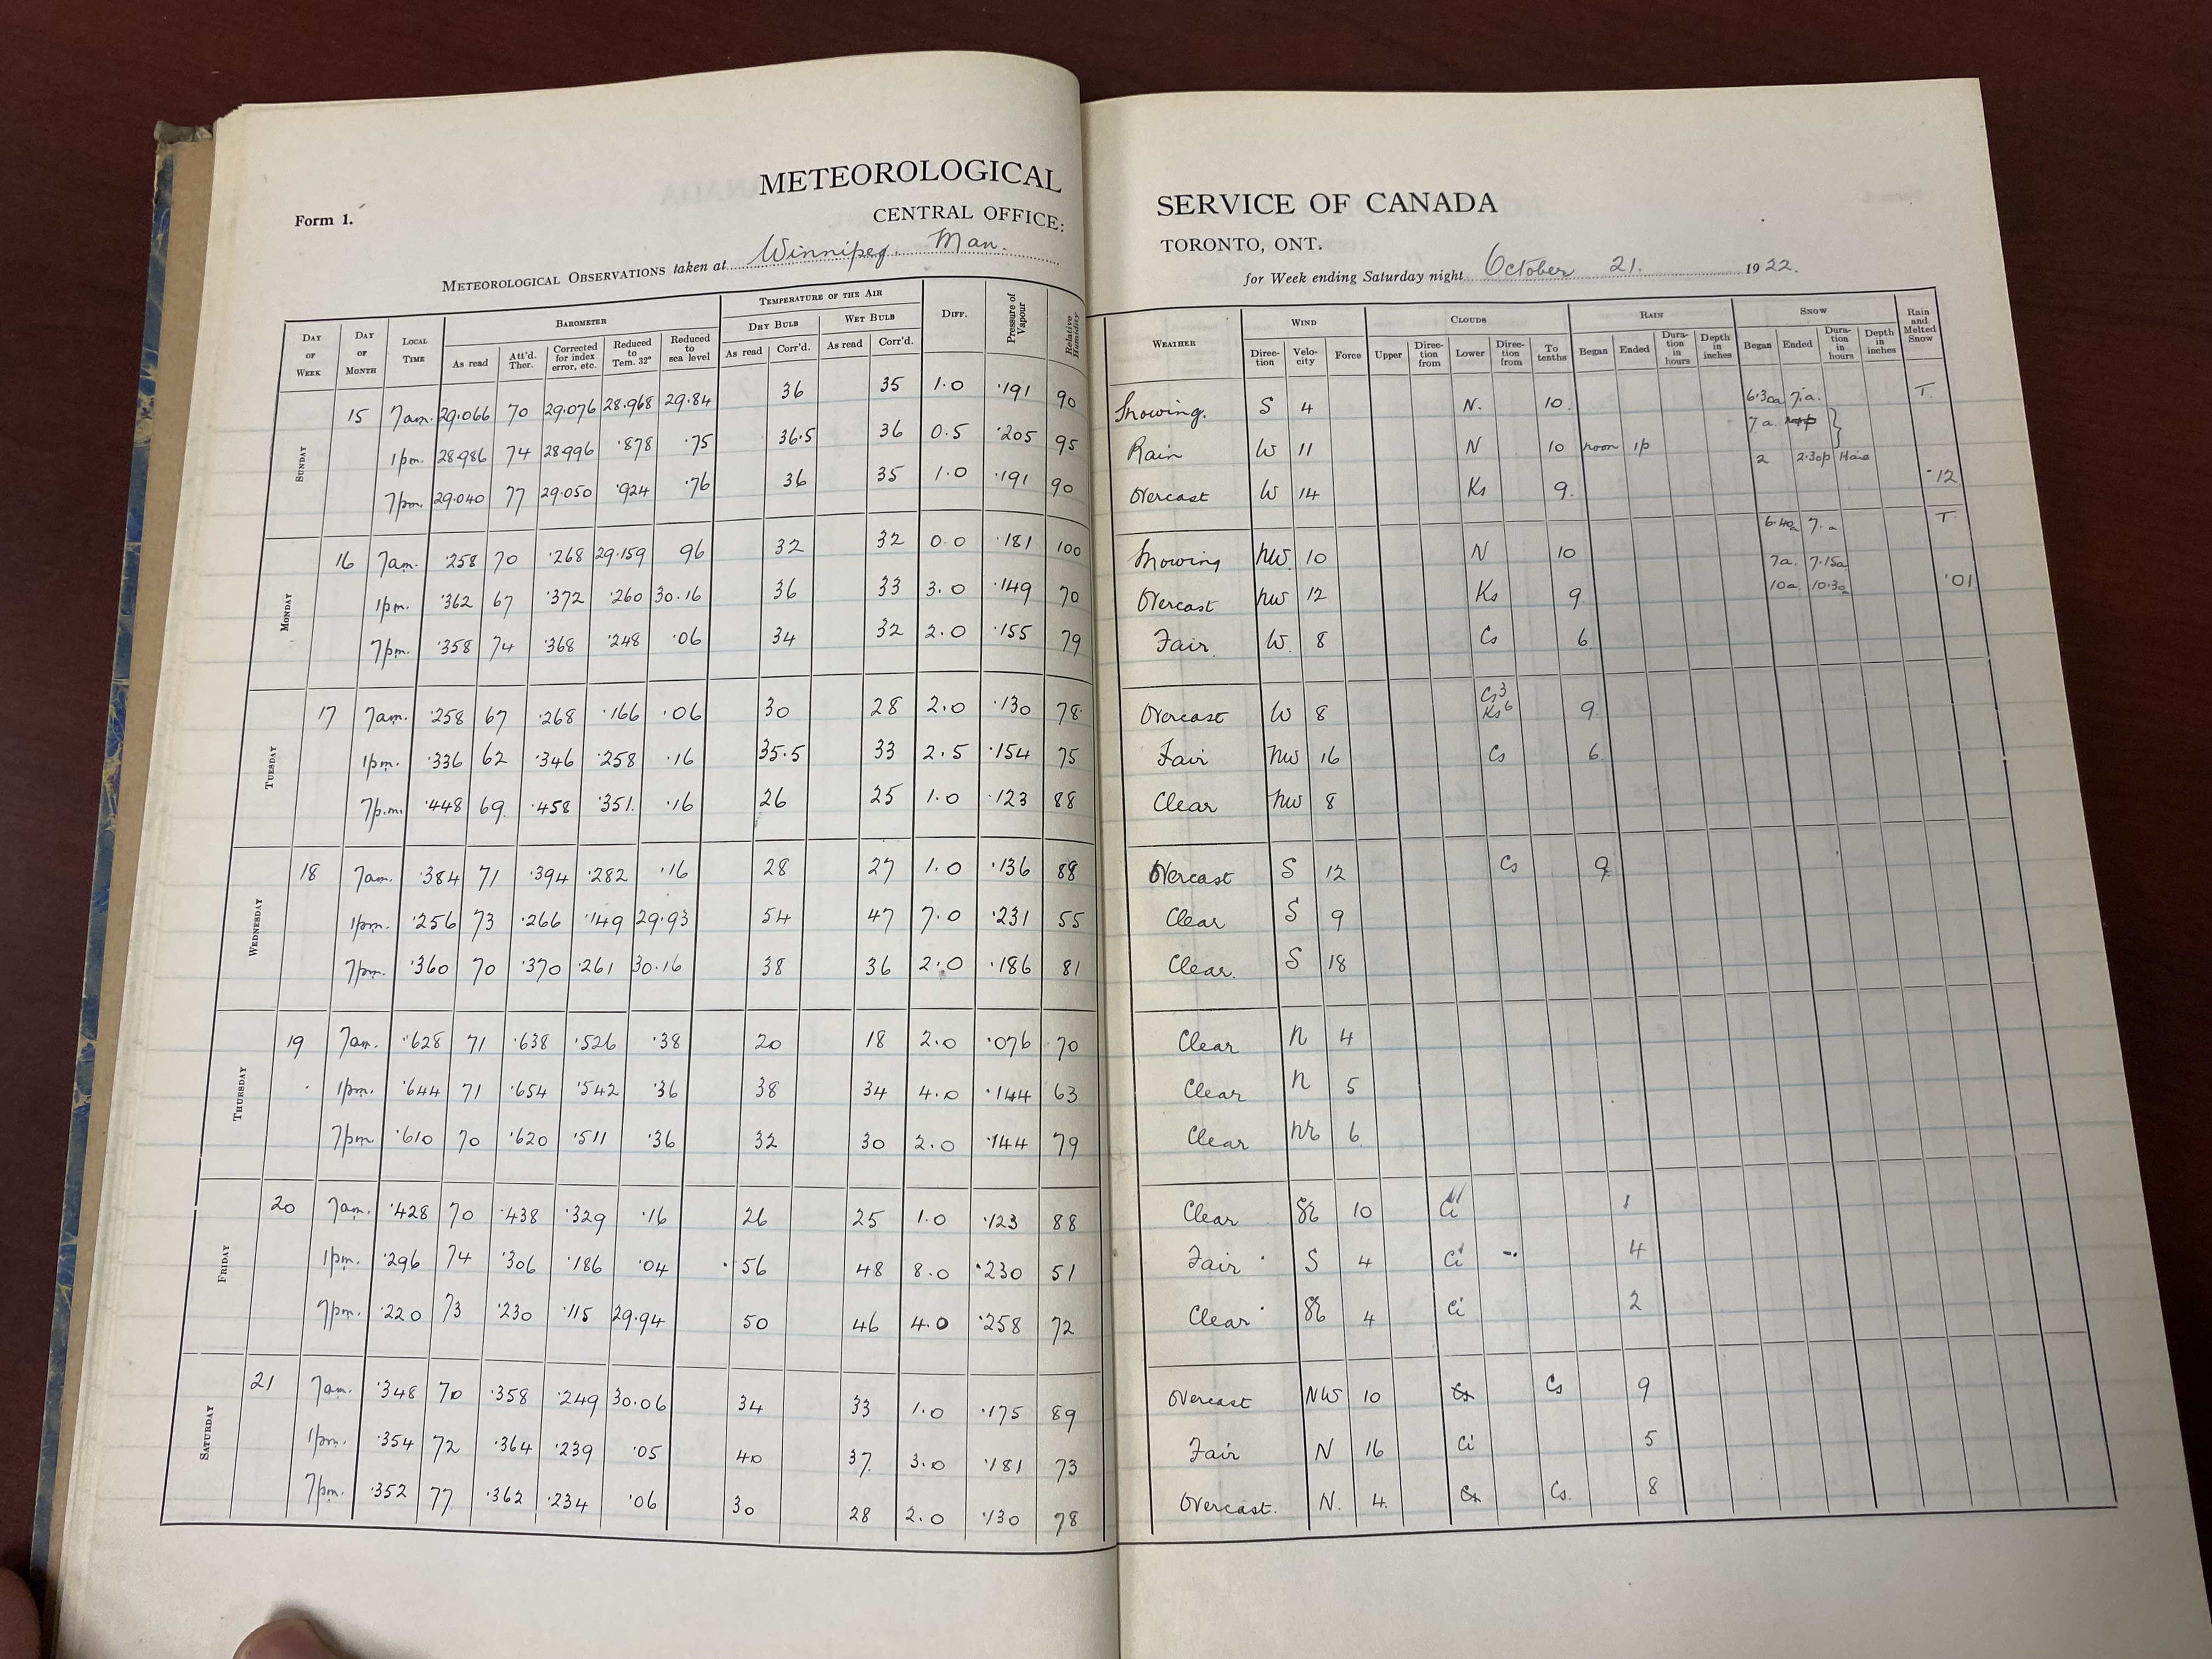
Oct 15, 1922 - Some evidence suggests that much if not all of the snow actually melted on contact. St John's College observer said the snow was melting on the ground at 7am. At noon to 2pm, rain was observed but ECCC does not have rain in the Archives. From the observer notes it is not clear how much of the precipitation was rain vs snow. All this raises some questions about how much snow actually fell on this date.
Graph form:

