Top 30 Wettest FEBRUARYS - WINNIPEG (since 1873)
|
Rank |
Rainfall
(mm) |
Snowfall
(cm) |
Precipitation
(mm) |
Rank |
|||
|
1 |
26.7 |
1998 |
89.9 |
1881 |
89.9 |
1881 |
1 |
|
2 |
23.6 |
2000 |
64.0 |
1921 |
64.0 |
1921 |
2 |
|
3 |
13.5 |
2009 E |
53.8 |
1873 |
53.8 |
1873 |
3 |
|
4 |
10.2 |
1958 |
50.4 |
2022 |
50.2 |
1998 |
4 |
|
5 |
9.8 |
1996 SN |
50.0 |
1962 |
45.7 |
1908 |
5 |
|
6 |
5.8 |
1877 |
47.5 |
1961 |
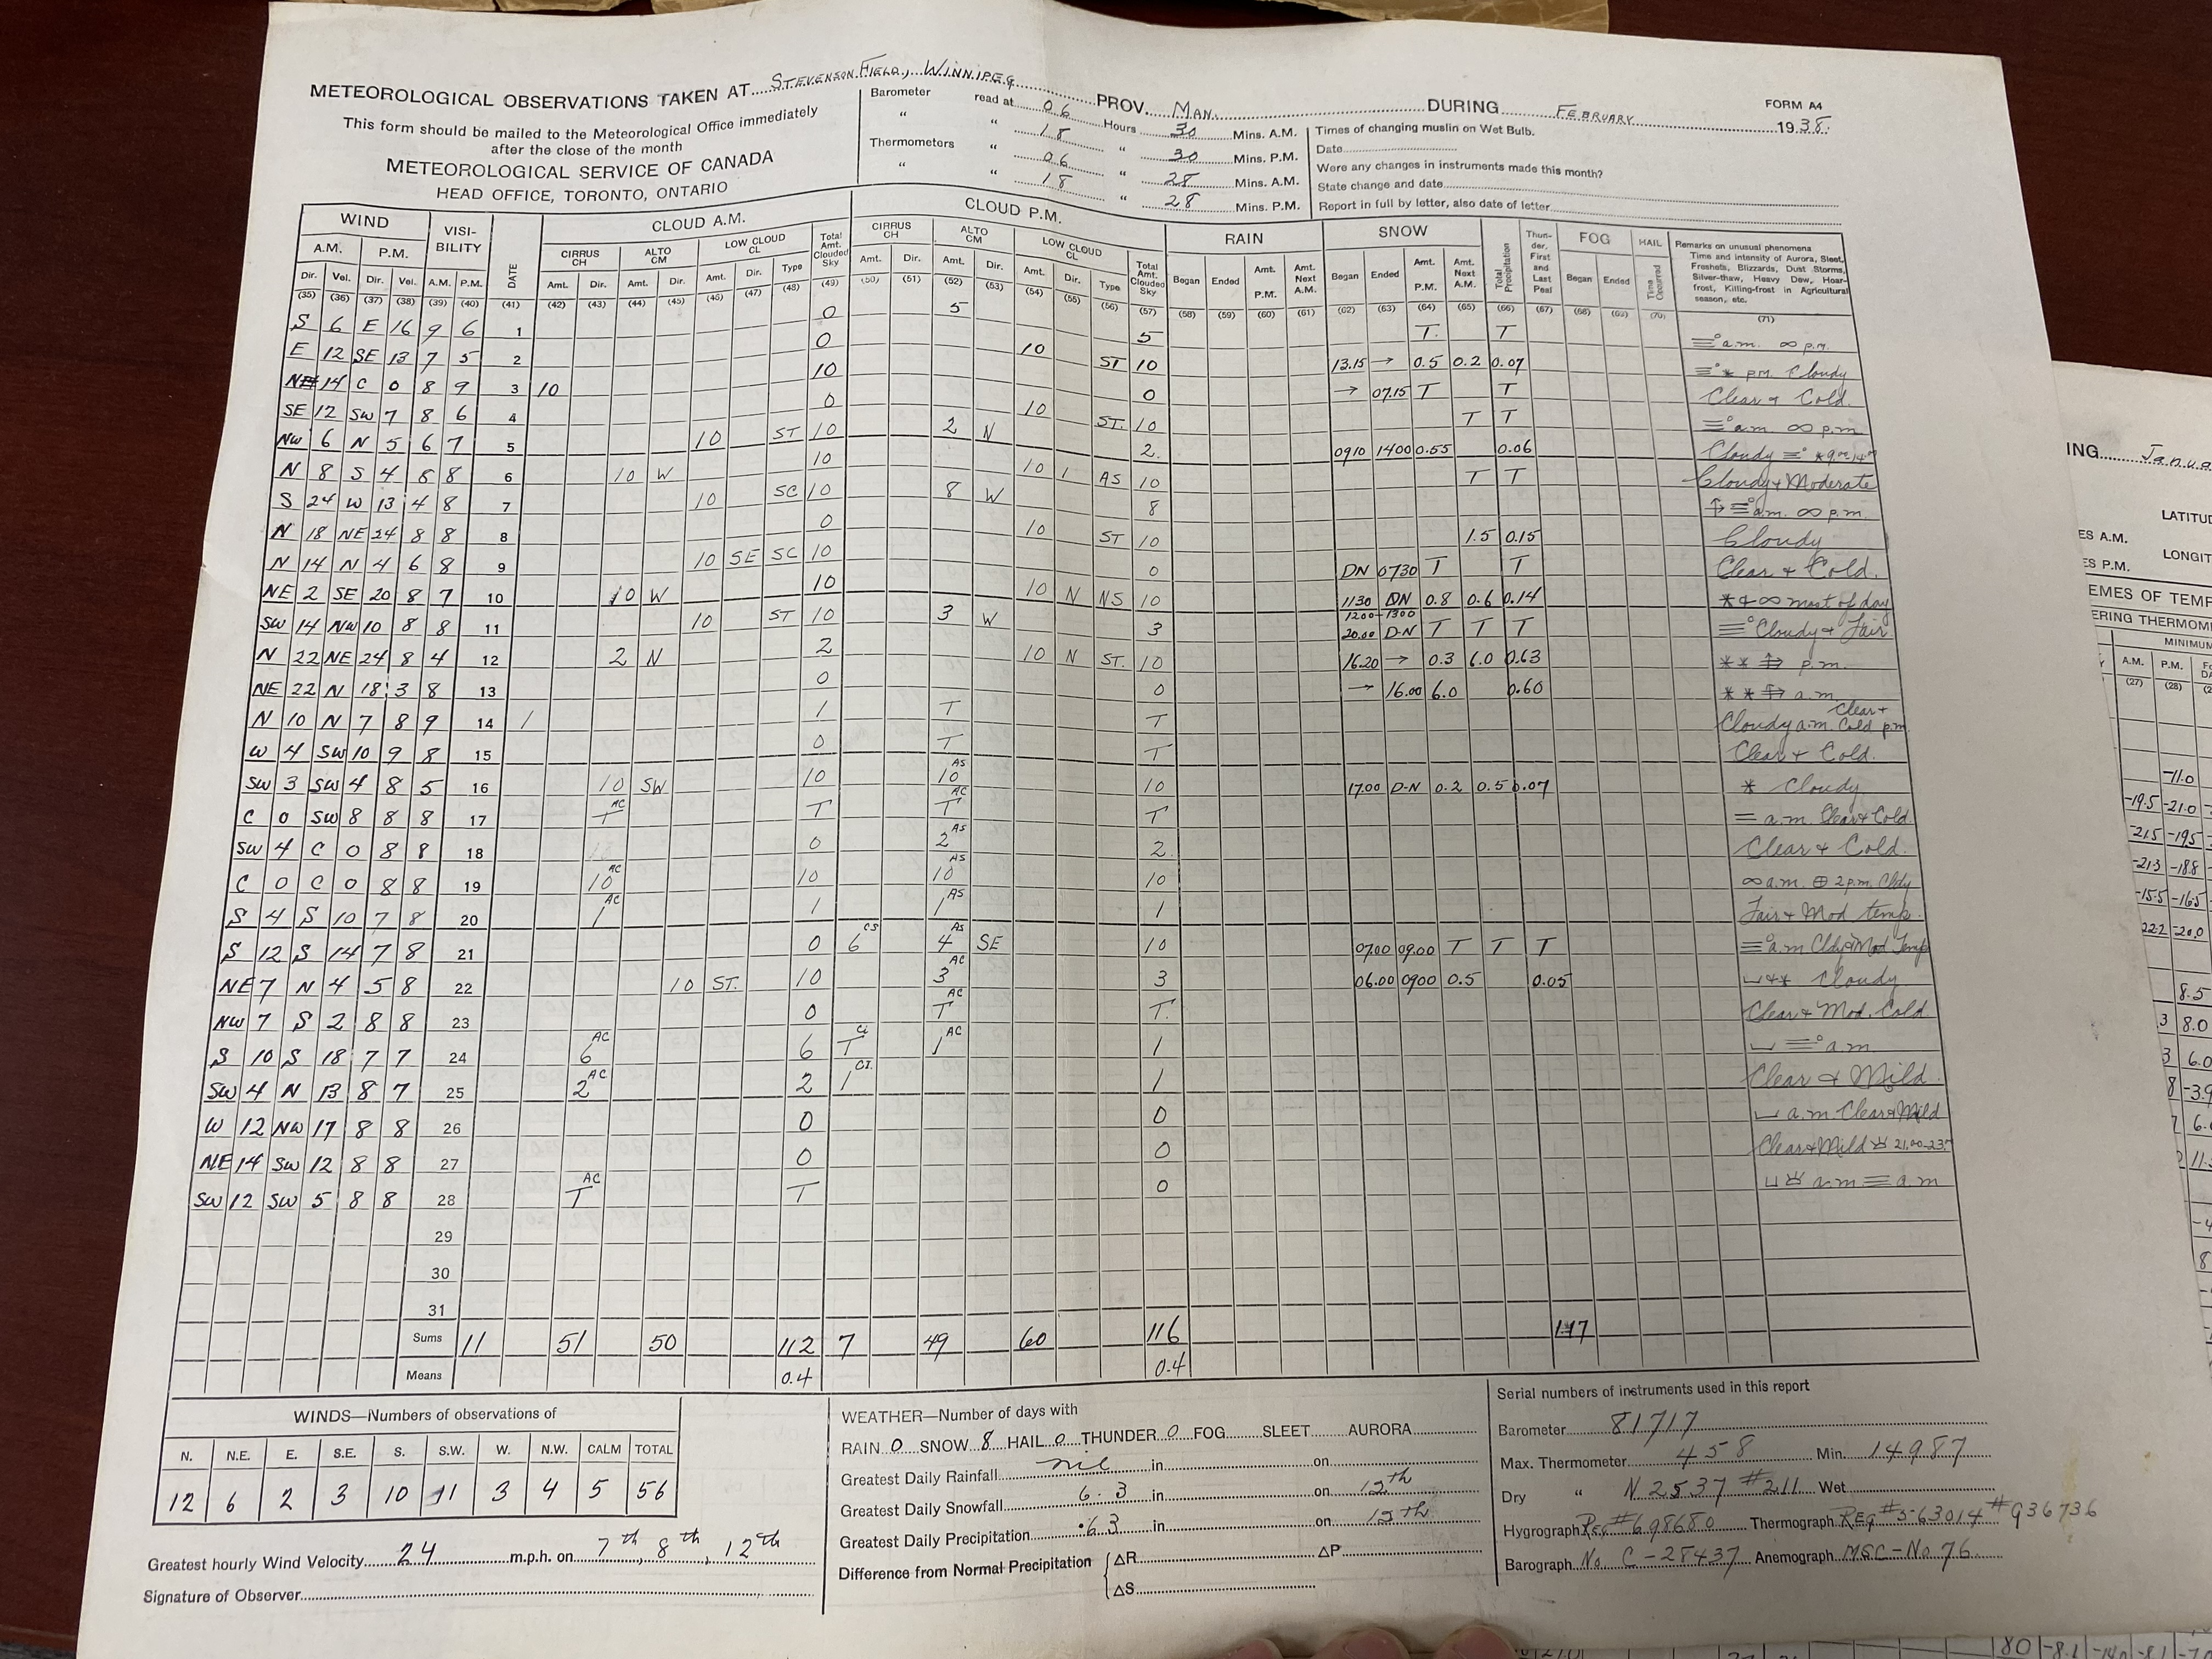
45.0 |
1938
O |
6 |
|
7 |
5.1 |
1878 |
45.0 |
1938 O |
41.7 |
1961 |
7 |
|
8 |
4.0 |
1984 |
44.5 |
1908 |
40.9 |
1987 |
8 |
|
9 |
3.6 |
1951 |
42.2 |
1987 |
39.9 |
1962 |
9 |
|
10 |
3.1 |
1983 |
39.6 |
1910 |
39.6 |
1910 |
10 |
|
11 |
3.0 |
1930 |
38.6 |
1893 |
38.9 |
1930 |
11 |
|
12 |
3.0 |
1999 |
38.4 |
2019 |
38.6 |
1893 |
12 |
|
13 |
2.7 |
2024 E |
37.6 |
1939 |
37.6 |
1939 |
13 |
|
14 |
2.5 |
1963 |
37.6 |
1955 |
37.6 |
1955 |
14 |
|
15 |
2.0 |
1934 |
36.3 |
1963 |
36.6 |
1996 D |
15 |
|
16 |
2.0 |
2011 |
35.8 |
1930 |
35.6 |
1936 |
16 |
|
17 |
1.8 |
1960 |
35.6 |
1936 |
34.8 |
1884 |
17 |
|
18 |
1.5 |
1895 |
34.8 |
1884 |
31.5 |
1947 |
18 |
|
19 |
1.3 |
1908 |
31.0 |
1947 |
30.7 |
2022 U |
19 |
|
20 |
1.3 |
1927 |
30.0 |
1937 |
30.0 |
1895 |
20 |
|
21 |
1.3 |
2017 E |
30.0 |
1976 |
30.0 |
1937 |
21 |
|
22 |
1.0 |
1997 |
28.4 |
1895 |
30.0 |
2000 |
22 |
|
23 |
0.8 |
1973 |
27.8 |
1996 D |
29.5 |
1963 |
23 |
|
24 |
0.6 |
1947 |
27.2 |
1887 |
27.2 |
1887 |
24 |
|
25 |
0.6 |
1992 |
27.2 |
1898 |
27.2 |
1898 |
25 |
|
26 |
0.6 |
2022 |
27.2 |
1949 |
27.2 |
1949 |
26 |
|
27 |
0.5 |
1885 |
26.9 |
1915 |
27.2 |
1956 |
27 |
|
28 |
0.5 |
1950 |
26.9 |
1956 |
26.9 |
1915 |
28 |
|
29 |
0.5 |
1975 |
26.4 |
1953 |
26.7 |
1953 |
29 |
|
30 |
0.4 |
1982 |
26.2 |
1889 |
26.2 |
1889 |
30 |
1938 - The Airport data were found at the Library Archives of Canada in Winnipeg. 45.0 cm of snow (45.0 mm precip) fell at the Airport in February 1938.
1996 rain - A significant portion of the rain reported in the ECCC Archives on the 22nd and 23rd was actually snow that melted on contact. In particular, the 2.2 mm reported on the 23rd was entirely snow that melted on contact. It is uncertain how much of the 5.6 mm on the 22nd was actually rain and not snow melting on contact.
1996 snow/precip - 0.4 cm and 0.2 mm on the 28th actually fell on March 1st during the overnight. For some reason, ECCC used a 12z-12z climate day instead of 06z-06z. I moved these amounts to March 1st as a result.
2009 - Confidence in rainfall amount high. Due to serious nipher shield issues, rainfall was double the reality at YWG on the 9th and 10th. XWG 13.2 mm + 0.3 mm was used instead. XWG also better matched other stations in the area, providing further proof of the issue at YWG.
2017 - Confidence in rainfall amount moderate-high. 0.2 mm on the 10th after 3am is considered estimated because of freezing rain and ice pellet mixture. All other rainfall amounts were certain because no other precip type was mixed with the rain.
2022 - Due to significant under catch of snowfall at XWG in snow and blowing snow, The Forks was used as a replacement for precipitation on the 1st, 3rd, 5th, 10th, 13th, 18th, 19th and 20th. This raised the precip amount for the month from 19.9 mm to 30.7 mm, which makes more sense given over 40 cm of snow in the month. Weatherlogics had measured 25.6 mm of precip during the month, and Charleswood 35.9 mm. XWG was much lower than any other station, providing sufficient evidence of under catch.
Graphs:
Rainfall:


