Top 30 Wettest NOVEMBERS - WINNIPEG (since 1872)
|
Rank |
Rainfall
(mm) |
Snowfall
(cm) |
Precipitation
(mm) |
Rank |
|||
|
1 |
62.2 |
1918 |
80.3 |
1955 |
90.2 |
1955 |
1 |
|
2 |
57.0 |
2000 |
77.2 |
1958 |
81.3 |
1958 |
2 |
|
3 |
45.2 |
1922 |
62.8 |
1996 |
77.0 |
1918 |
3 |
|
4 |
42.2 |
1928 |
60.7 |
1874 |
75.0 |
2000 |
4 |
|
5 |
38.6 |
1956 |
60.2 |
1965 |
64.0 |
1874 |
5 |
|
6 |
36.1 |
1962 |
57.9 |
1919 |
61.5 |
1922 |
6 |
|
7 |
32.0 |
2008 E |
57.7 |
1893 |
61.0 |
1932 |
7 |
|
8 |
24.6 |
1944 |
56.9 |
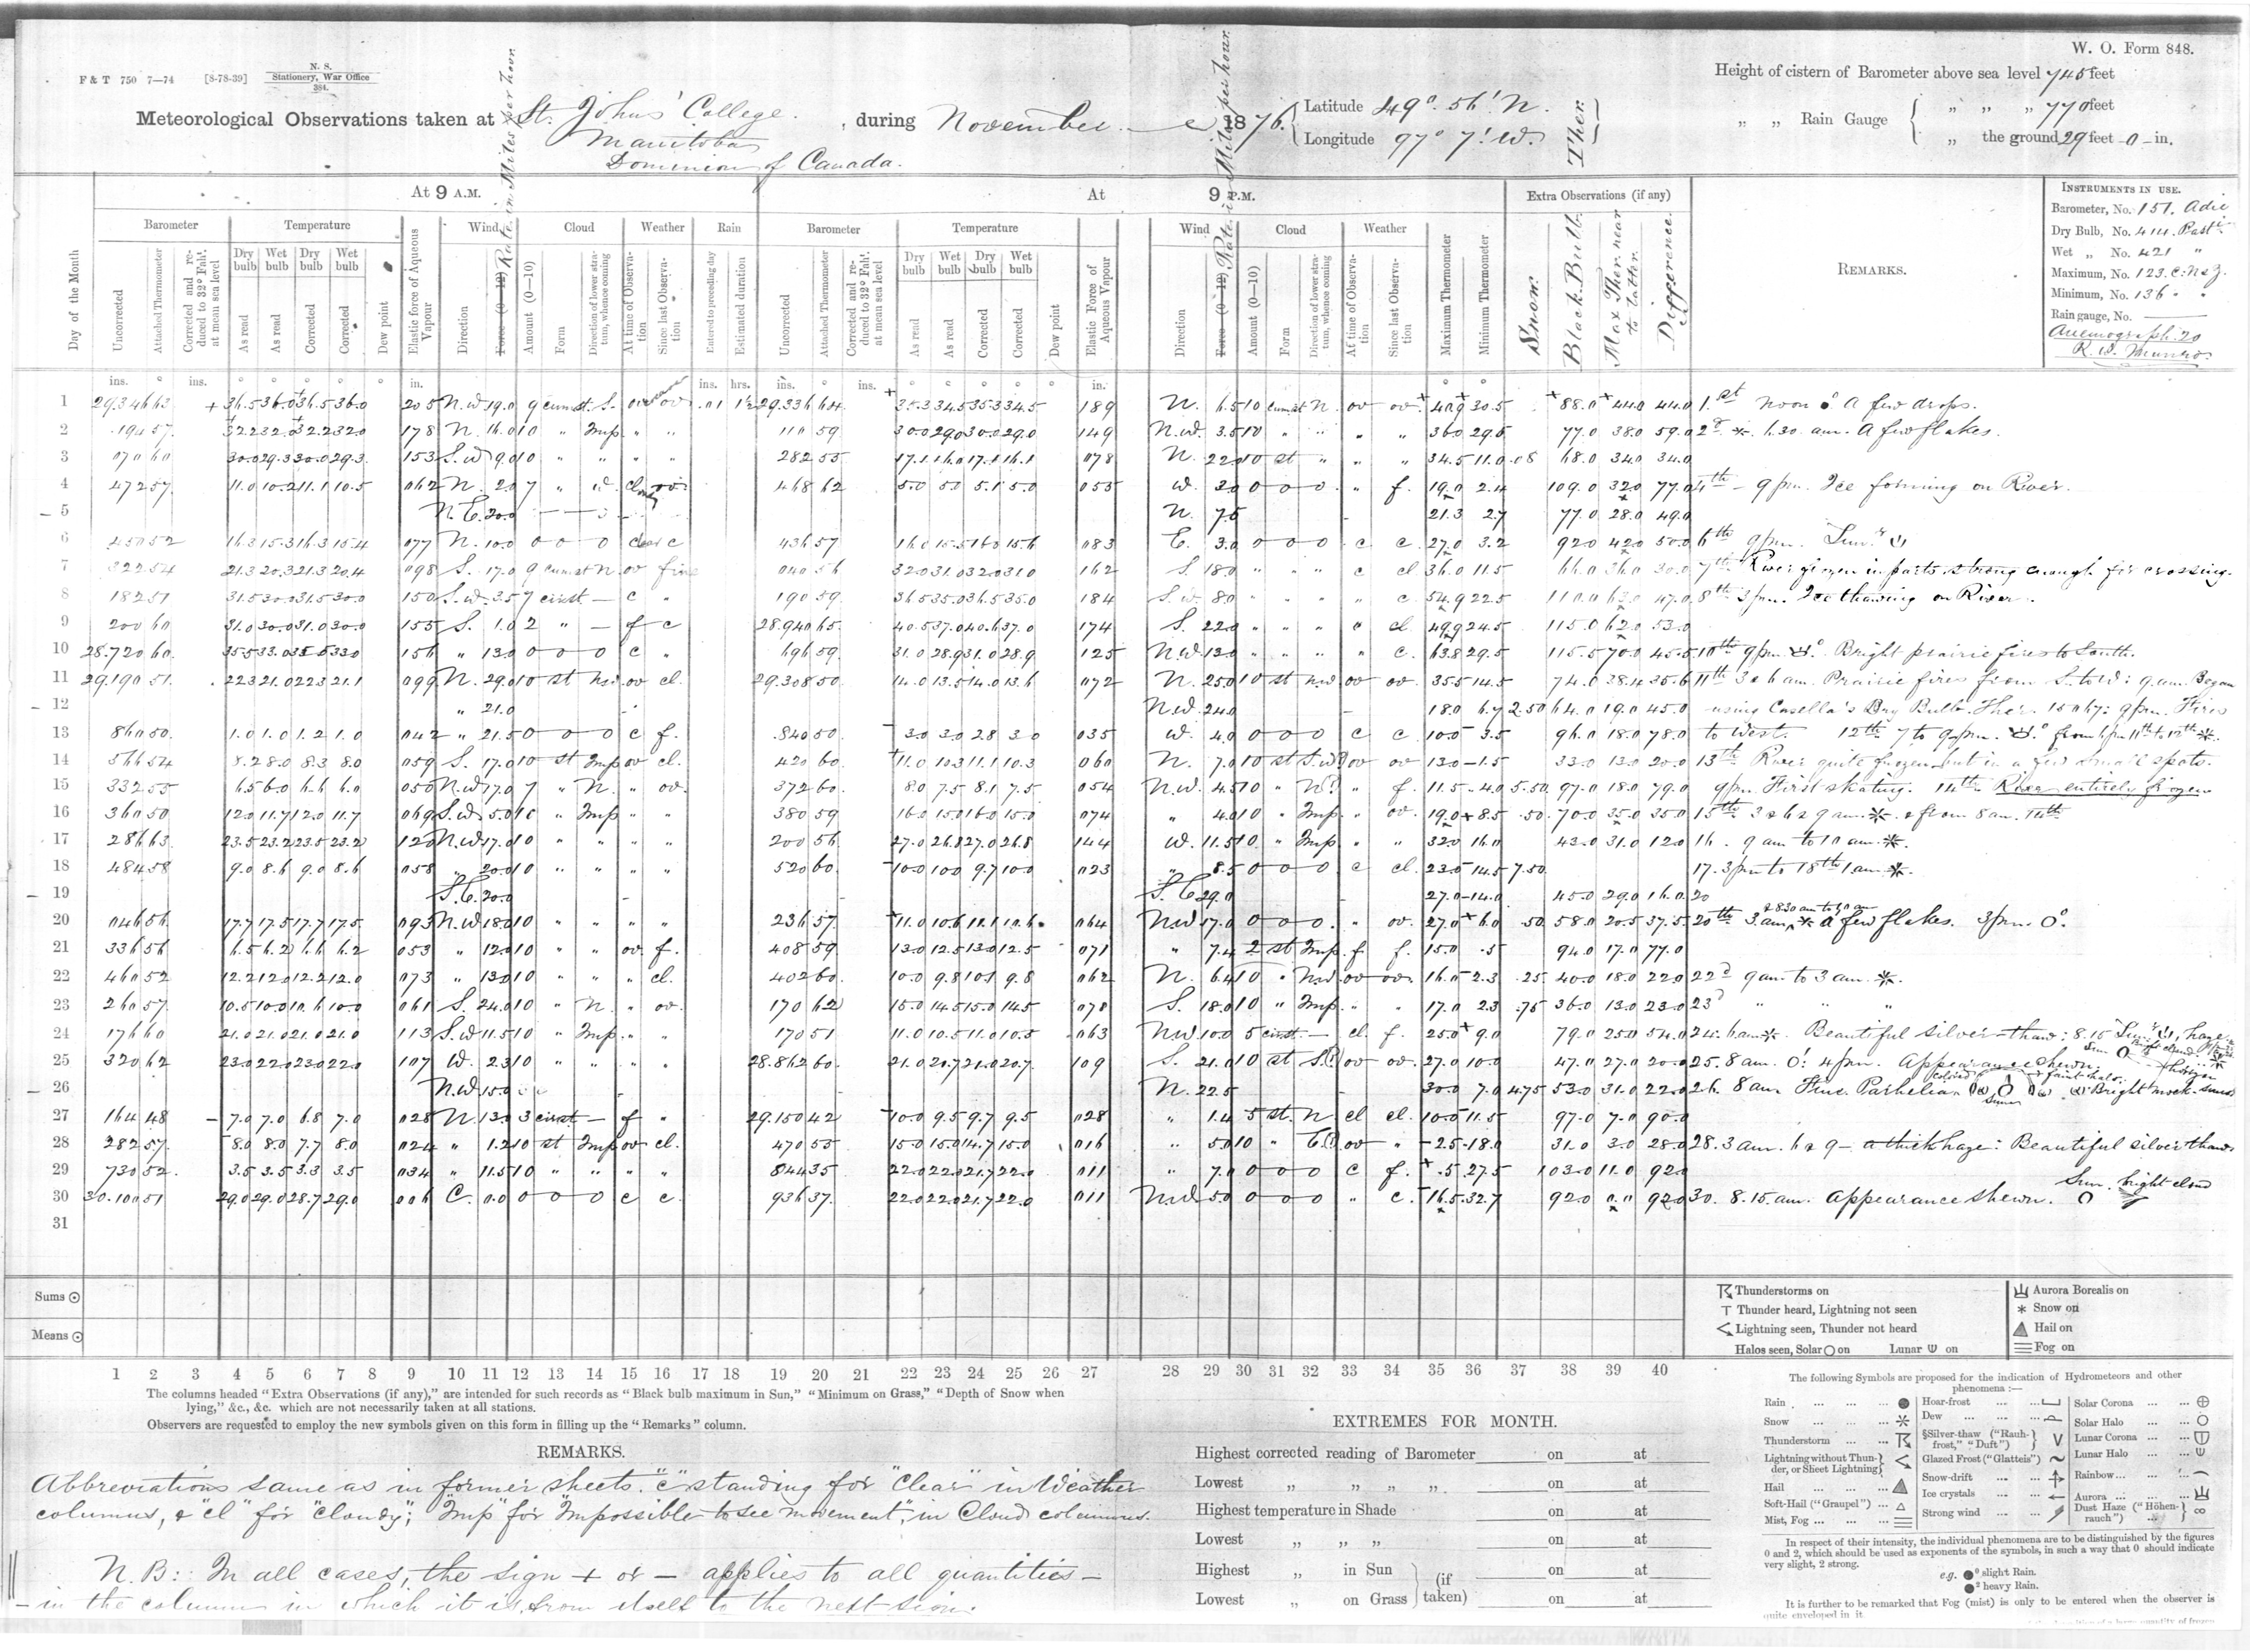
1876
O |
59.4 |
1893 |
8 |
|
9 |
22.9 |
1948 |
55.6 |
2010 |
58.4 |
1996 |
9 |
|
10 |
22.0 |
1994 |
51.8 |
1932 |
57.9 |
1919 |
10 |
|
11 |
18.3 |
1877 |
51.6 |
1892 |
57.4 |
1892 |
11 |
|
12 |
17.6 |
1984 |
50.0 |
1995 |
57.2 |
1876
O |
12 |
|
13 |
15.7 |
1923 |
48.3 |
1898 |
54.6 |
1962 |
13 |
|
14 |
15.0 |
1913 |
47.4 |
1986 |
50.8 |
1898 |
14 |
|
15 |
14.2 |
1970 |
44.5 |
1894 |
49.0 |
1956 |
15 |
|
16 |
13.7 |
1990 |
44.3 |
1985 |
48.4 |
1986 |
16 |
|
17 |
12.2 |
1895 |
43.7 |
1933 |
47.5 |
1894 |
17 |
|
18 |
11.7 |
1937 |
42.7 |
1926 |
47.5 |
1906 |
18 |
|
19 |
11.0 |
1987 |
41.6 |
2005 |
46.5 |
1944 |
19 |
|
20 |
10.7 |
1954 |
39.8 |
1992 |
44.6 |
1995 |
20 |
|
21 |
10.2 |
1882 |
39.8 |
2012 |
44.5 |
2008 |
21 |
|
22 |
10.0 |
2023
E |
38.1 |
1903 |
44.2 |
1965 |
22 |
|
23 |
9.9 |
1906 |
37.6 |
1906 |
43.9 |
1985 |
23 |
|
24 |
9.9 |
1955 |
37.1 |
1973 |
43.7 |
1933 |
24 |
|
25 |
9.7 |
2015 E |
36.4 |
1978 |
43.0 |
2005 |
25 |
|
26 |
9.5 |
2002 |
35.6 |
1930 |
42.7 |
1926 |
26 |
|
27 |
9.4 |
1920 |
35.6 |
1945 |
42.6 |
1978 |
27 |
|
28 |
9.1 |
1932 |
33.3 |
1896 |
42.2 |
1928 |
28 |
|
29 |
9.0 |
2005 |
32.3 |
1910 |
40.1 |
1973 |
29 |
|
30 |
8.9 |
1931 |
31.8 |
1883 |
39.4 |
1930 |
30 |
1876 - Observer notes show 6.4 cm of snow on the 12th, which for an unknown reason ECCC omitted in the Archives. The snowfall is corroborated by St Andrews which had 10.2 cm. This raises the monthly snowfall amount from 50.5 cm to 56.9 cm and the precip amount from 50.8 mm to 57.2 mm (assuming 10:1 ratio).
2008 - See Nov 6 issues. Nov 7, mostly freezing rain 06z-07z therefore assume the 0.5 mm at CXWG that hour is a good rainfall amount for the day. Rainfall the 13th was also estimated due to mixed and switching rain and snow. Precip amounts at YWG AWOS the 12th-13th might be too high due to nipher shield issues, but not enough evidence to confirm.
2015 - Missing data on the 4th was retrieved via metar/synops (0.6 mm rain/precip). Rain on the 6th considered estimated due to mixed precipitation. Missing data filled in with The Forks on the 10th (trace rain/precip). Don't know what happened in the second half of the month at XWG, but it did not catch any of the precip that fell. Have used The Forks as replacement for the 16th to 26th period as a result (XWG recorded 0.5 mm during the period but every other station I could find had precip amounts over 13 mm). All these corrections resulted in an estimated rainfall amount of 9.7 mm, and an increase in precipitation from 8.3 mm to 21.3 mm.
2023 - Rainfall considered estimated due to some mixed precipitation from the 7th to 9th. Margin of error is less than a mm, so quite accurate.
Graphs:
Rainfall:


