|
Overview
|
The painting above was by Paul Kane in the 1850s, and shows St Boniface on the left and Winnipeg on the right, separated by the Red River.
|
I have collected any information that I can find from the 19th century in the Winnipeg area to get a better idea of what the weather was like and to better understand the range of weather that is possible. If you click the ''Full year-by-year summary'' button at the top of this page, you will find the entirety of the data I collected. On this page, I summarize all the data to highlight the main findings.
Data sources and types
Most data sources are qualitative - meaning that they are descriptions of the weather by people in the area. Sporadic temperature or snowfall measurements were mentioned at random from time to time.
- Manitoba Keystone Archives
- Upper Fort Garry / Red River / Winnipeg Post Journals (1797-1860)
- Samuel Taylor Journals around Winnipeg (1859-1869)
- Lower Fort Garry Journals near Selkirk (1868-1874)
- Brandon House Journals SE of Brandon
- Research Publications
- W.F. Rannie 2001 University of Wpg (Assessment of the Historic Hydrology of the Assiniboine River and Watershed 1793-1870)
- W.F. Rannie 2006 University of Wpg (Evidence for Episodes of Unusually Wet 19th Century Summers in the Eastern Prairies and Northwestern Ontario)
- T.R. Allsopp 1977 Downsview Gov of Canada (Agricultural Weather in the Red River Basin of Southern Manitoba over the Period 1800 to 1975)
- D.D. Kemp 1982 Lakehead University (The Drought of 1804-1805 in Central North America)
- Yumpu (website) - Floods and High Water Events. Author and publication unknown, I assume it is W.F. Rannie.
- W.F. Rannie 1983: Breakup and Freezeup of the Red River at Winnipeg, Manitoba Canada in the 19th Century and some Climatic Implications
- W.F. Rannie and Danny Blair 1994 University of Wpg (Wading to Pembina: 1849 Spring and Summer Weather in the Valley of the Red River of the North and Some Climatic Implications)
- Canadiana
- Alexander Begg Journal (1869-1870)
- David Anderson (1852) - Notes of the Flood of the Red River
- Open Data Rescue Project (1869-1873) - Includes daily temperature and precipitation measurements
- ClimateStations.com
- Minneapolis (1820-present)
- University of Manitoba Libraries Newspaper Collection
- The NorWester (1858-1869) - includes weather observations from the Royal Canadian Rifles and James Stewart
- The Manitoban and Northwest Herald (1870-1874)
- New Nation (1870)
- Manitoba News-Letter (1870-1871)
- Le Métis (1871-1881)
- University of Alberta Libraries
- Provencher Letters (1818-1853)
- York University
- Google Books:
- Donald Gunn Meteorological Registers (1855-56): ''Report on the Exploration of the Country Between Lake Superior and Red River Settlement''
- Alexander Ross: The Red River Settlement: its Rise, Progress and Present State. Published 1856.
- Check out this page for a few more links to weather history in the Winnipeg area.
Data limitations
Due to the mostly qualitative nature of the data, some subjectivity is inherent in how the weather was described by people. For instance, what would be considered warm weather to one person may have been described as cold by someone else. Other examples of subjectivity and data limitations include:
- ''Sleet'' is a term that is difficult to understand due to its inherent vagueness. It can be used for wet snow, rain-snow mix or ice pellets.
- ''Dinner-time'' is difficult to distinguish between lunch and supper. From what I could tell, it mostly referred to lunch time in the 19th century.
- Temperature and precipitation were not necessarily measured using modern methods, and thus, cannot be fully compared to official data from 1872 to present.
- It was not always clear that the descriptions were at Winnipeg specifically - sometimes people travelled to other parts of the region, e.g. Selkirk.
- Gaps in available data (particularly 1830s and 1840s) - I try to fill in with journals from other areas nearby. The Selkirk area often has supplemental reports, and if needed I reference to Brandon or Pembina ND if available.
MAps
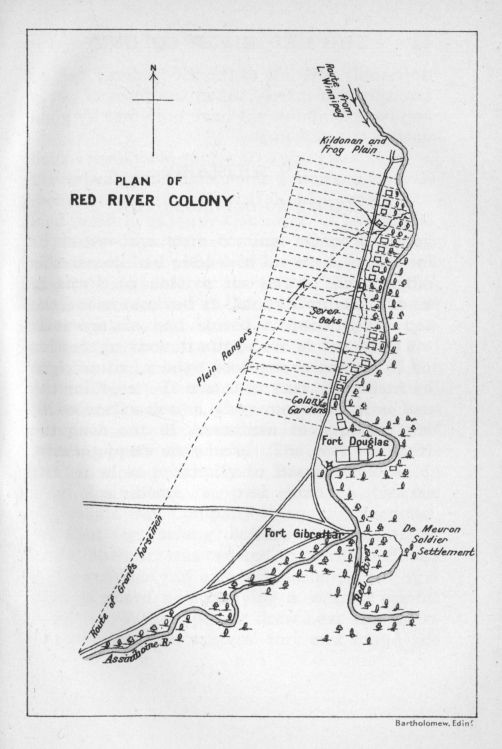
Red River Settlement area in 1818, via Manitoba Historical Maps
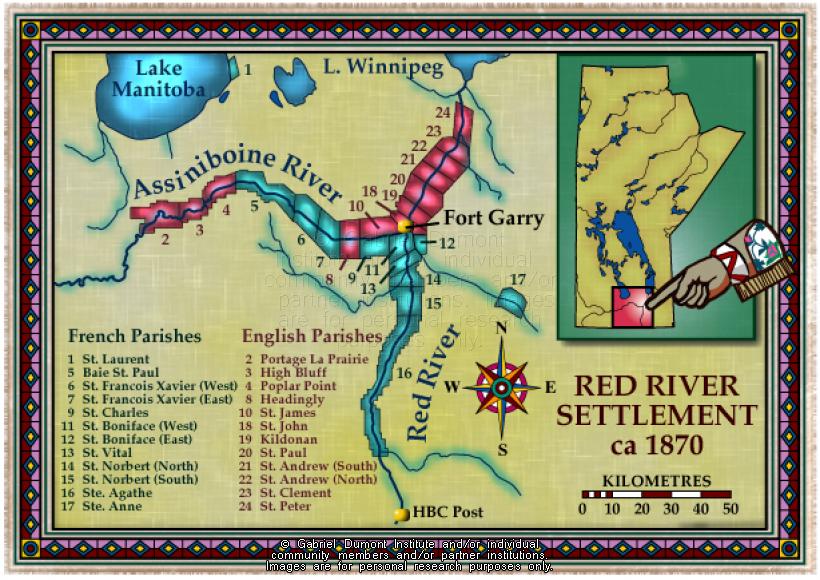
The Red River Settlement area map of 1870, via the Métis Virtual Museum
Winter Highlights (December to February)
rain
1821 - ''Heavy rain'' in the evening of Jan 7. Some rain on Feb 11.
mild winters
extreme cold
1820 December - Cold to severe cold every day after the first couple days.
major snowstorms
late snow pack initiation
thunderstorms
deep snow packs - snowy winters
Spring Highlights (March to May)
early springs
1798 - River breaks up & rises high in the first half of April. No snow mentioned in April. Heavy rain Mar 29 with overland flooding.
1800 - River open by March 24. At Brandon: geese/ducks by Mar 18. Warm weather last week of March with some rain the 19th.
1804 - At Pembina, snow was described as gone by March 19th to 21st.
1818 - Red River open at Point Douglas on April 10.
1800 - River open by March 24. At Brandon: geese/ducks by Mar 18. Warm weather last week of March with some rain the 19th.
1804 - At Pembina, snow was described as gone by March 19th to 21st.
1818 - Red River open at Point Douglas on April 10.
late springs
1806 - Banks of snow still lying on the edge of forests on May 1st. Extraordinary cold/snowy/stormy weather in April.
1815 - ''Very backward'' spring. Last wheat sown May 25. On June 4, very few leaves yet on trees and Lake Winnipeg still frozen.
1817 - Backward spring at Brandon.
1821 - River cleared May 1. Snow remained on ground until mid or late April (unclear exactly when, but Apr 12 was still covered).
1815 - ''Very backward'' spring. Last wheat sown May 25. On June 4, very few leaves yet on trees and Lake Winnipeg still frozen.
1817 - Backward spring at Brandon.
1821 - River cleared May 1. Snow remained on ground until mid or late April (unclear exactly when, but Apr 12 was still covered).
thunderstorms
spring floods
1815 - Red River overflowing its banks to a considerable distance in May. Snowy winter with a delayed spring.
1826
1849
1852
1861
1826
1849
1852
1861
Summer Highlights (June to August)
snow
frost
June frost: 1816 (Brandon), 1817 (Brandon)
July frost: 1817 (Brandon)
August frost: 1817 (Brandon)
July frost: 1817 (Brandon)
August frost: 1817 (Brandon)
heat
1805 - Potato crop failed due to excessive heat early in the season.
thunderstorms
1821 - ''Very frequent and abundant'' storms, always accompanied with terrible thunder, from June to August.
Fall Highlights (September to November)
september snow
winter-like octobers (early starts to winter)
1817 - At Brandon, Assiniboine River frozen over by Oct 23.
thunderstorms
General Highlights
Damaging synoptic winds
Drought years
1804-1805 - Severe drought over central North America. Possibly extended into the Winnipeg area.
1816 to 1819 - Persistent drought with grasshopper infestations and remarkably low river levels. Very poor crops leading to desperation. Prairie grass short or barely growing. This resulted in stunted progress of the settlement and river transportation being replaced with carts on land. Spring 1816: Barely any rain with parched ground. 1818: Scarce a single shower of rain all summer. Virtually no crop harvested. 1819 - Virtually no crop harvested. In 1820, a party of men travelled to Wisconsin to buy seed wheat so that they could have a crop this year. Grasshoppers returned in 1821 to cause more damage.
1816 to 1819 - Persistent drought with grasshopper infestations and remarkably low river levels. Very poor crops leading to desperation. Prairie grass short or barely growing. This resulted in stunted progress of the settlement and river transportation being replaced with carts on land. Spring 1816: Barely any rain with parched ground. 1818: Scarce a single shower of rain all summer. Virtually no crop harvested. 1819 - Virtually no crop harvested. In 1820, a party of men travelled to Wisconsin to buy seed wheat so that they could have a crop this year. Grasshoppers returned in 1821 to cause more damage.
Smoke and fires
1802 - Much grass in the Red River Valley was burned from fires. This caused snow to blow off easily in subsequent winters.
very low river levels (generic)
1800 - August 22, Red River lower than has ever been known before.
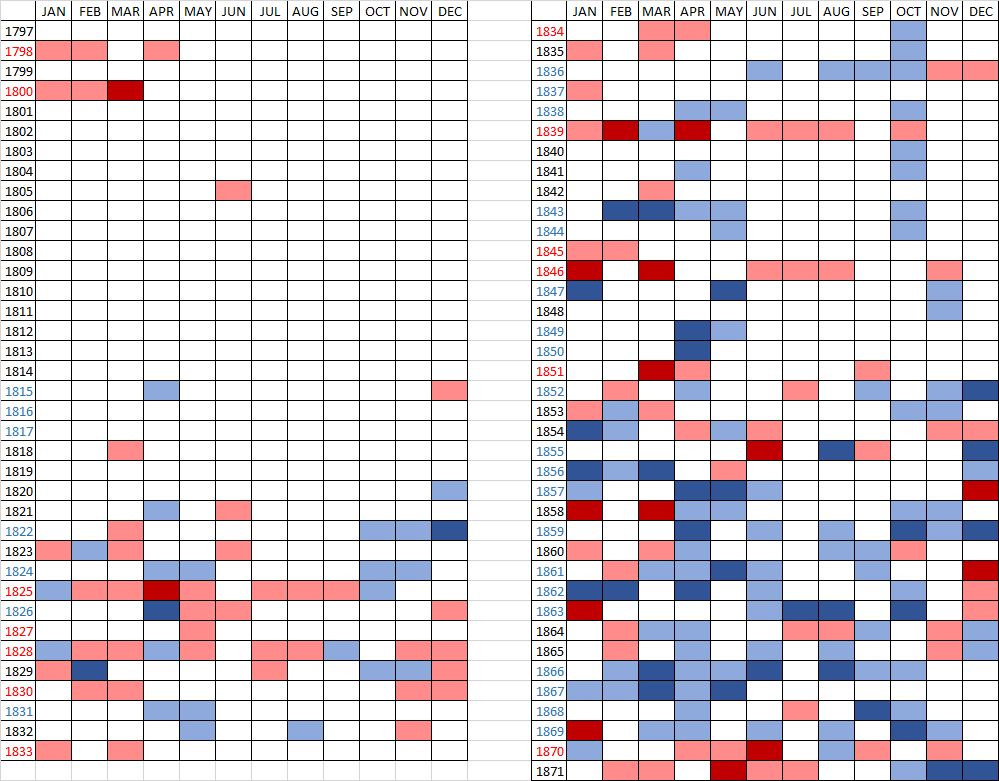
Warm and Cold Months illustrated
The table below shows estimates for each month of how warm and cold it was. If a month is white, it indicates either that there wasn't enough conclusive data (or no data at all) or the month was near normal. Dark red and dark blue show decisive anomalies, often including extreme warmth or extreme cold. The year is also colour coded to show if the year was cold or warm overall.
The table below shows estimates for each month of how warm and cold it was. If a month is white, it indicates either that there wasn't enough conclusive data (or no data at all) or the month was near normal. Dark red and dark blue show decisive anomalies, often including extreme warmth or extreme cold. The year is also colour coded to show if the year was cold or warm overall.