MAY Daily Precipitation Records - WINNIPEG (since 1873)
|
Day |
High rainfall |
High
snowfall |
High Precip |
Day |
|||
|
1 |
27.9 |
1902 |
21.1 |
1967 |
27.9 |
1902 |
1 |
|
2 |
19.8 |
1902 |
5.3 |
1954 |
19.8 |
1902 |
2 |
|
3 |
20.8 |
1964 |
2.5 |
1891 |
20.8 |
1964 |
3 |
|
4 |
50.8 |
1977 |
9.4 |
1905 |
50.8 |
1977 |
4 |
|
5 |
34.0 |
1950 |
12.2 |
1931 |
34.5 |
1950 |
5 |
|
6 |
29.7 |
1889
D |
4.1 |
1938 |
29.7 |
1889 D |
6 |
|
7 |
25.2 |
1997 D |
3.8 |
1905 |
25.2 |
1997 D |
7 |
|
8 |
48.5 |
1930 A |
3.0 |
1907 |
48.5 |
1930 A |
8 |
|
9 |
24.1 |
1896 |
20.0 |
2002 |
24.1 |
1896 |
9 |
|
10 |
15.7 |
1974* |
4.4 |
1979 |
15.7 |
1974* |
10 |
|
11 |
67.6 |
1911 |
20.0 |
2004 |
71.1 |
1911 |
11 |
|
12 |
32.5 |
1905 |
2.0 |
2004 |
32.5 |
1905 |
12 |
|
13 |
38.5 |
2009 E |
1.8 |
1997 D |
38.5 |
2009 E |
13 |
|
14 |
36.6 |
1948 |
8.1 |
1890 |
36.6 |
1948 |
14 |
|
15 |
17.5 |
1896* |
0.5 |
1890 |
17.5 |
1896* |
15 |
|
16 |
29.0 |
1928 |
7.9 |
1890 |
29.0 |
1928 |
16 |
|
17 |
31.0 |
2015 E |
7.9 |
1968 |
31.3 |
2015 |
17 |
|
18 |
39.5 |
2003 |
3.0 |
1963 |
39.5 |
2003 |
18 |
|
19 |
54.4 |
1974 |
20.3 |
1931 |
54.4 |
1974 |
19 |
|
20 |
38.4 |
1974 |
15.2 |
1882 |
38.4 |
1974 |
20 |
|
21 |
28.5 |
2005 |
T |
2022 |
28.5 |
2005 |
21 |
|
22 |
40.6 |
2021 |
1.3 |
1949 |
40.6 |
2021 |
22 |
|
23 |
23.4 |
1973 |
1.3 |
1949 |
23.4 |
1973 |
23 |
|
24 |
32.3 |
1970 |
0.3 |
1924 |
32.3 |
1970 |
24 |
|
25 |
60.2 |
1978 |
T |
1890*** |
60.2 |
1978 |
25 |
|
26 |
37.1 |
1977 |
0.5 |
1890 |
37.1 |
1977 |
26 |
|
27 |
40.4 |
1912 |
1.8 |
1947 |
40.4 |
1912 |
27 |
|
28 |
27.0 |
2010 |
T |
1947 |
27.0 |
2010 |
28 |
|
29 |
53.0 |
2010 |
T |
1947 |
53.0 |
2010 |
29 |
|
30 |
35.2 |
2022 |
0.0 |
35.2 |
2022 |
30 |
|
|
31 |
44.2 |
1877 |
0.0 |
44.2 |
1877 |
31 |
|
May 17, 1870 - Unofficial rainfall/precipitation record of 36.8 mm. From the Open Data Rescue Project.
May 5-6, 1938 - St John's College recorded 13.0 cm and 5.1 cm (total 18.1 cm). These would be records on both dates. It appears Winnipeg was on the western edge of the storm system, explaining why the Airport had less snow than downtown.
Data Notes:
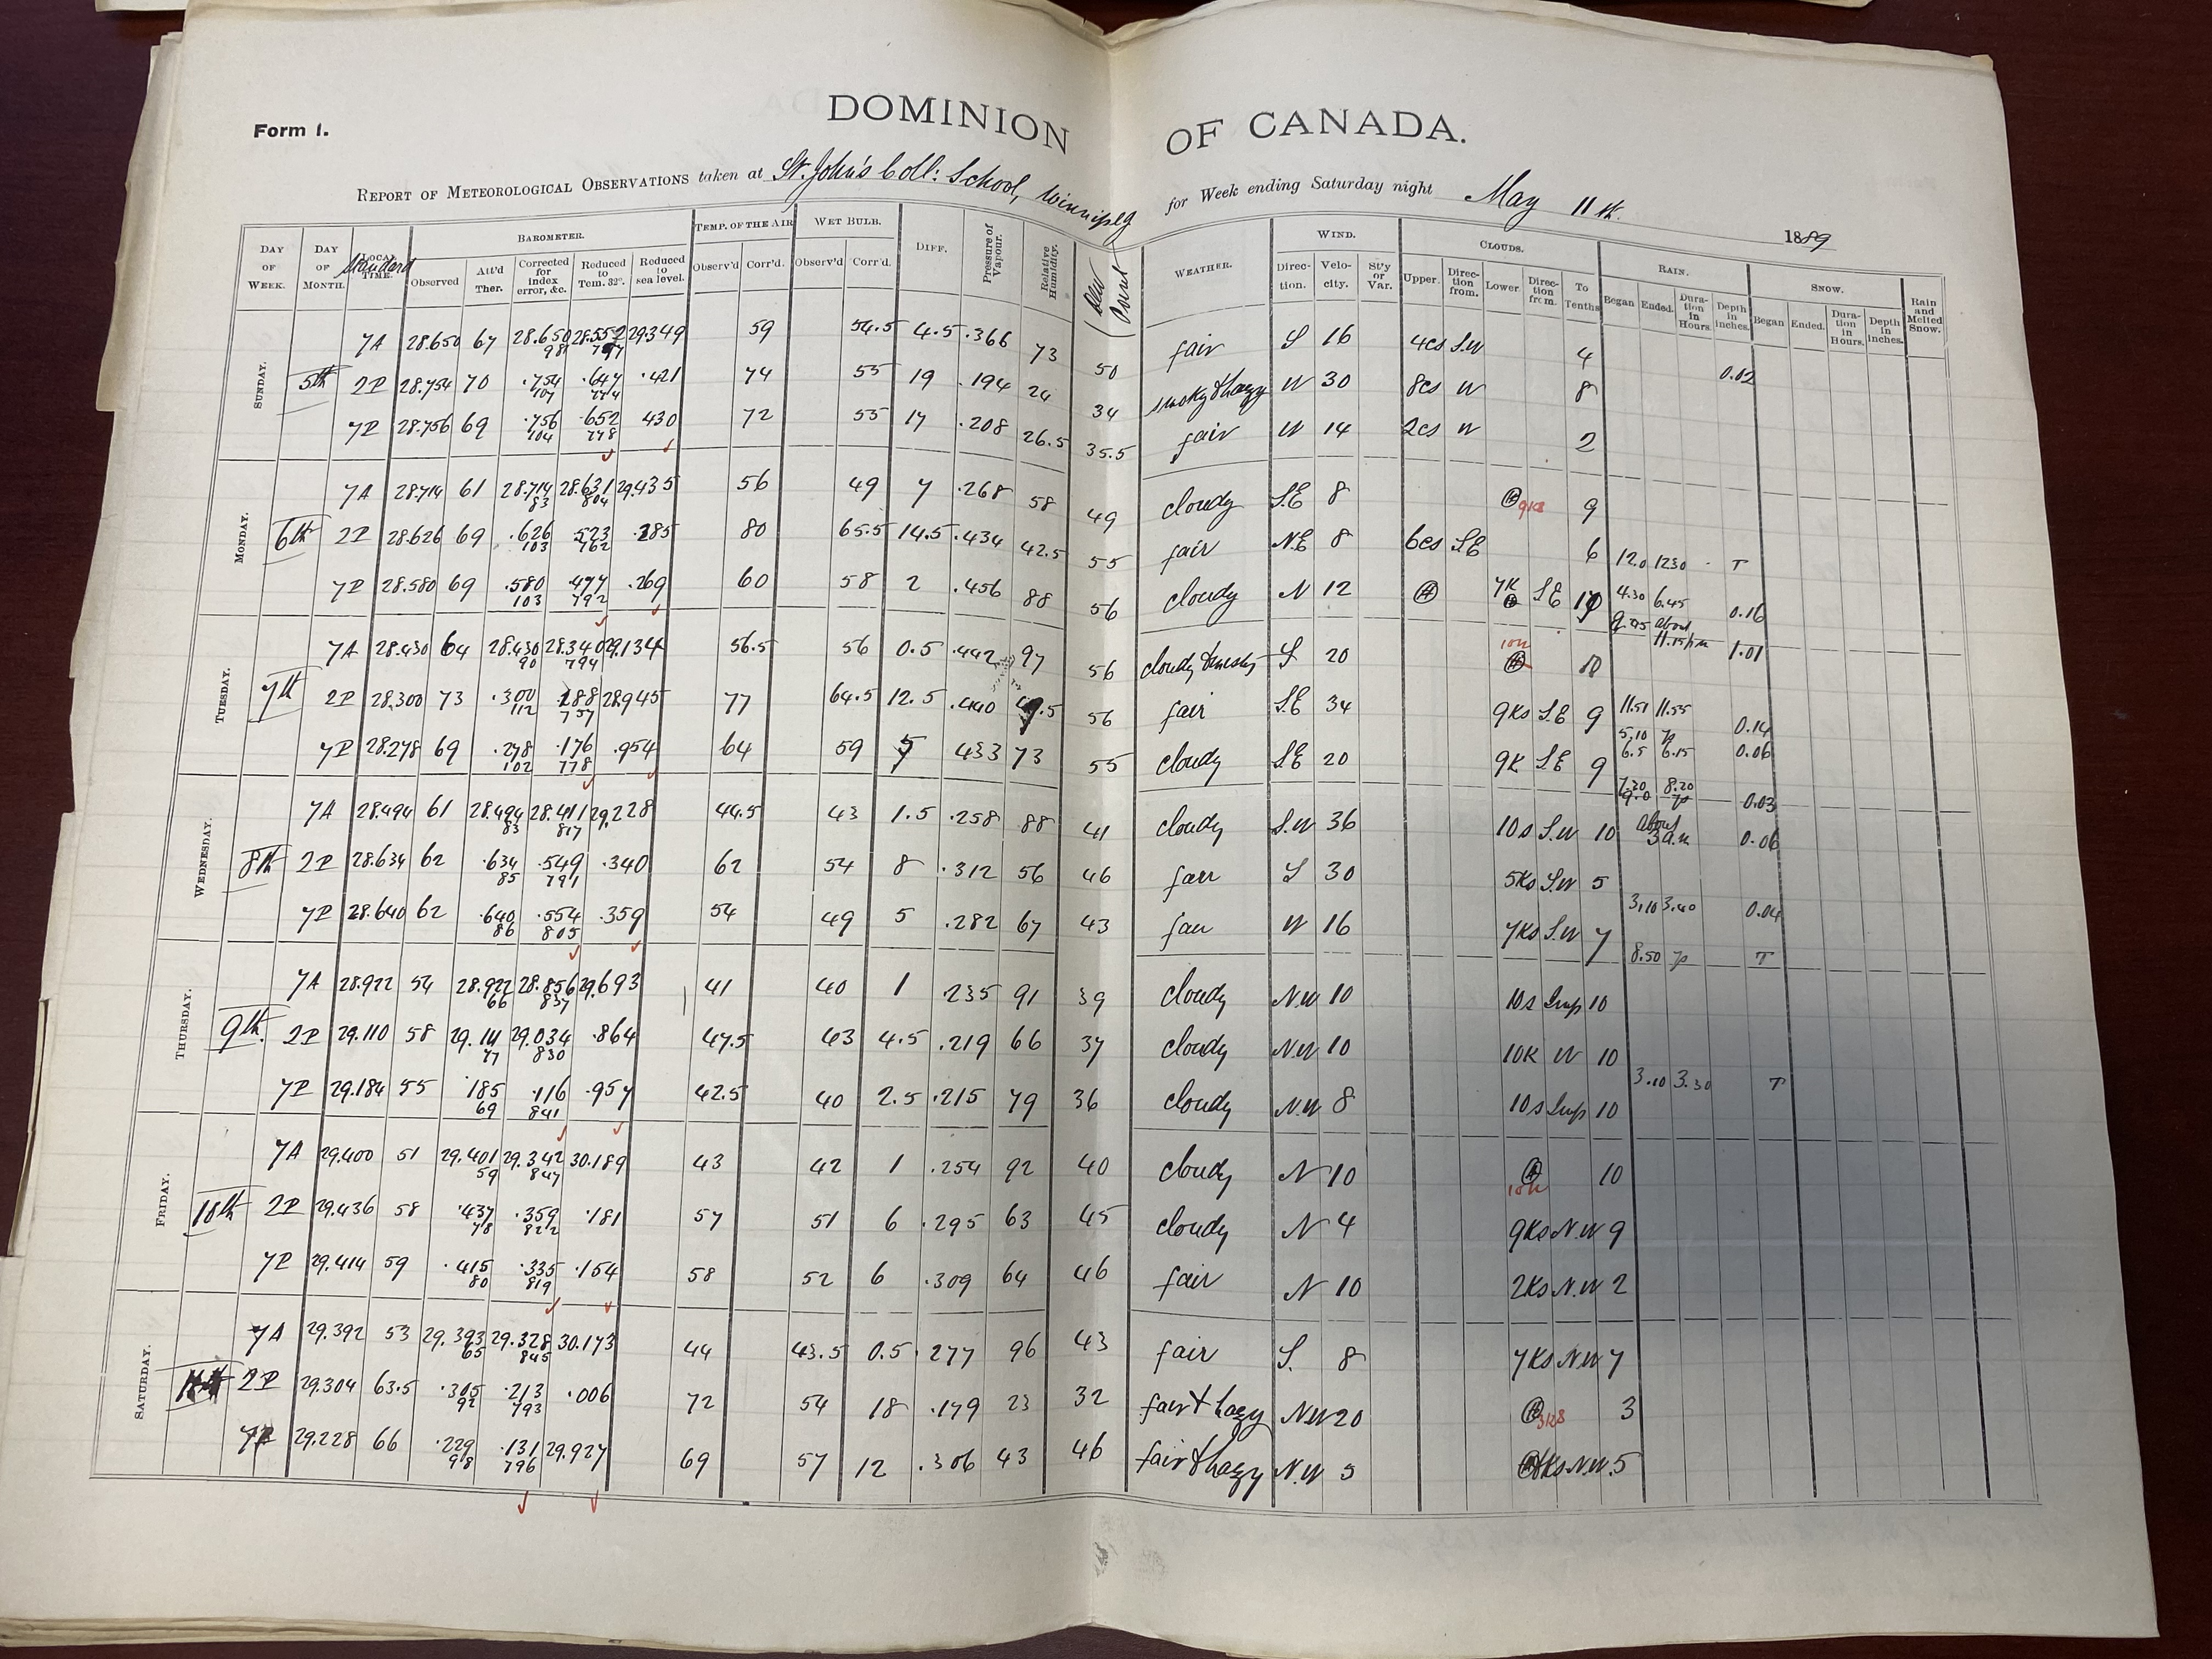
May 6-7, 1889 - The observer notes at St John's College show 29.7 mm of rain fell on the 6th alone, while only 5.8 mm fell on the 7th. The difference with the ECCC Archives is the climate day, which was from 7 pm to 7 pm. For the purposes of my records, I have changed the climate day to midnight-midnight.
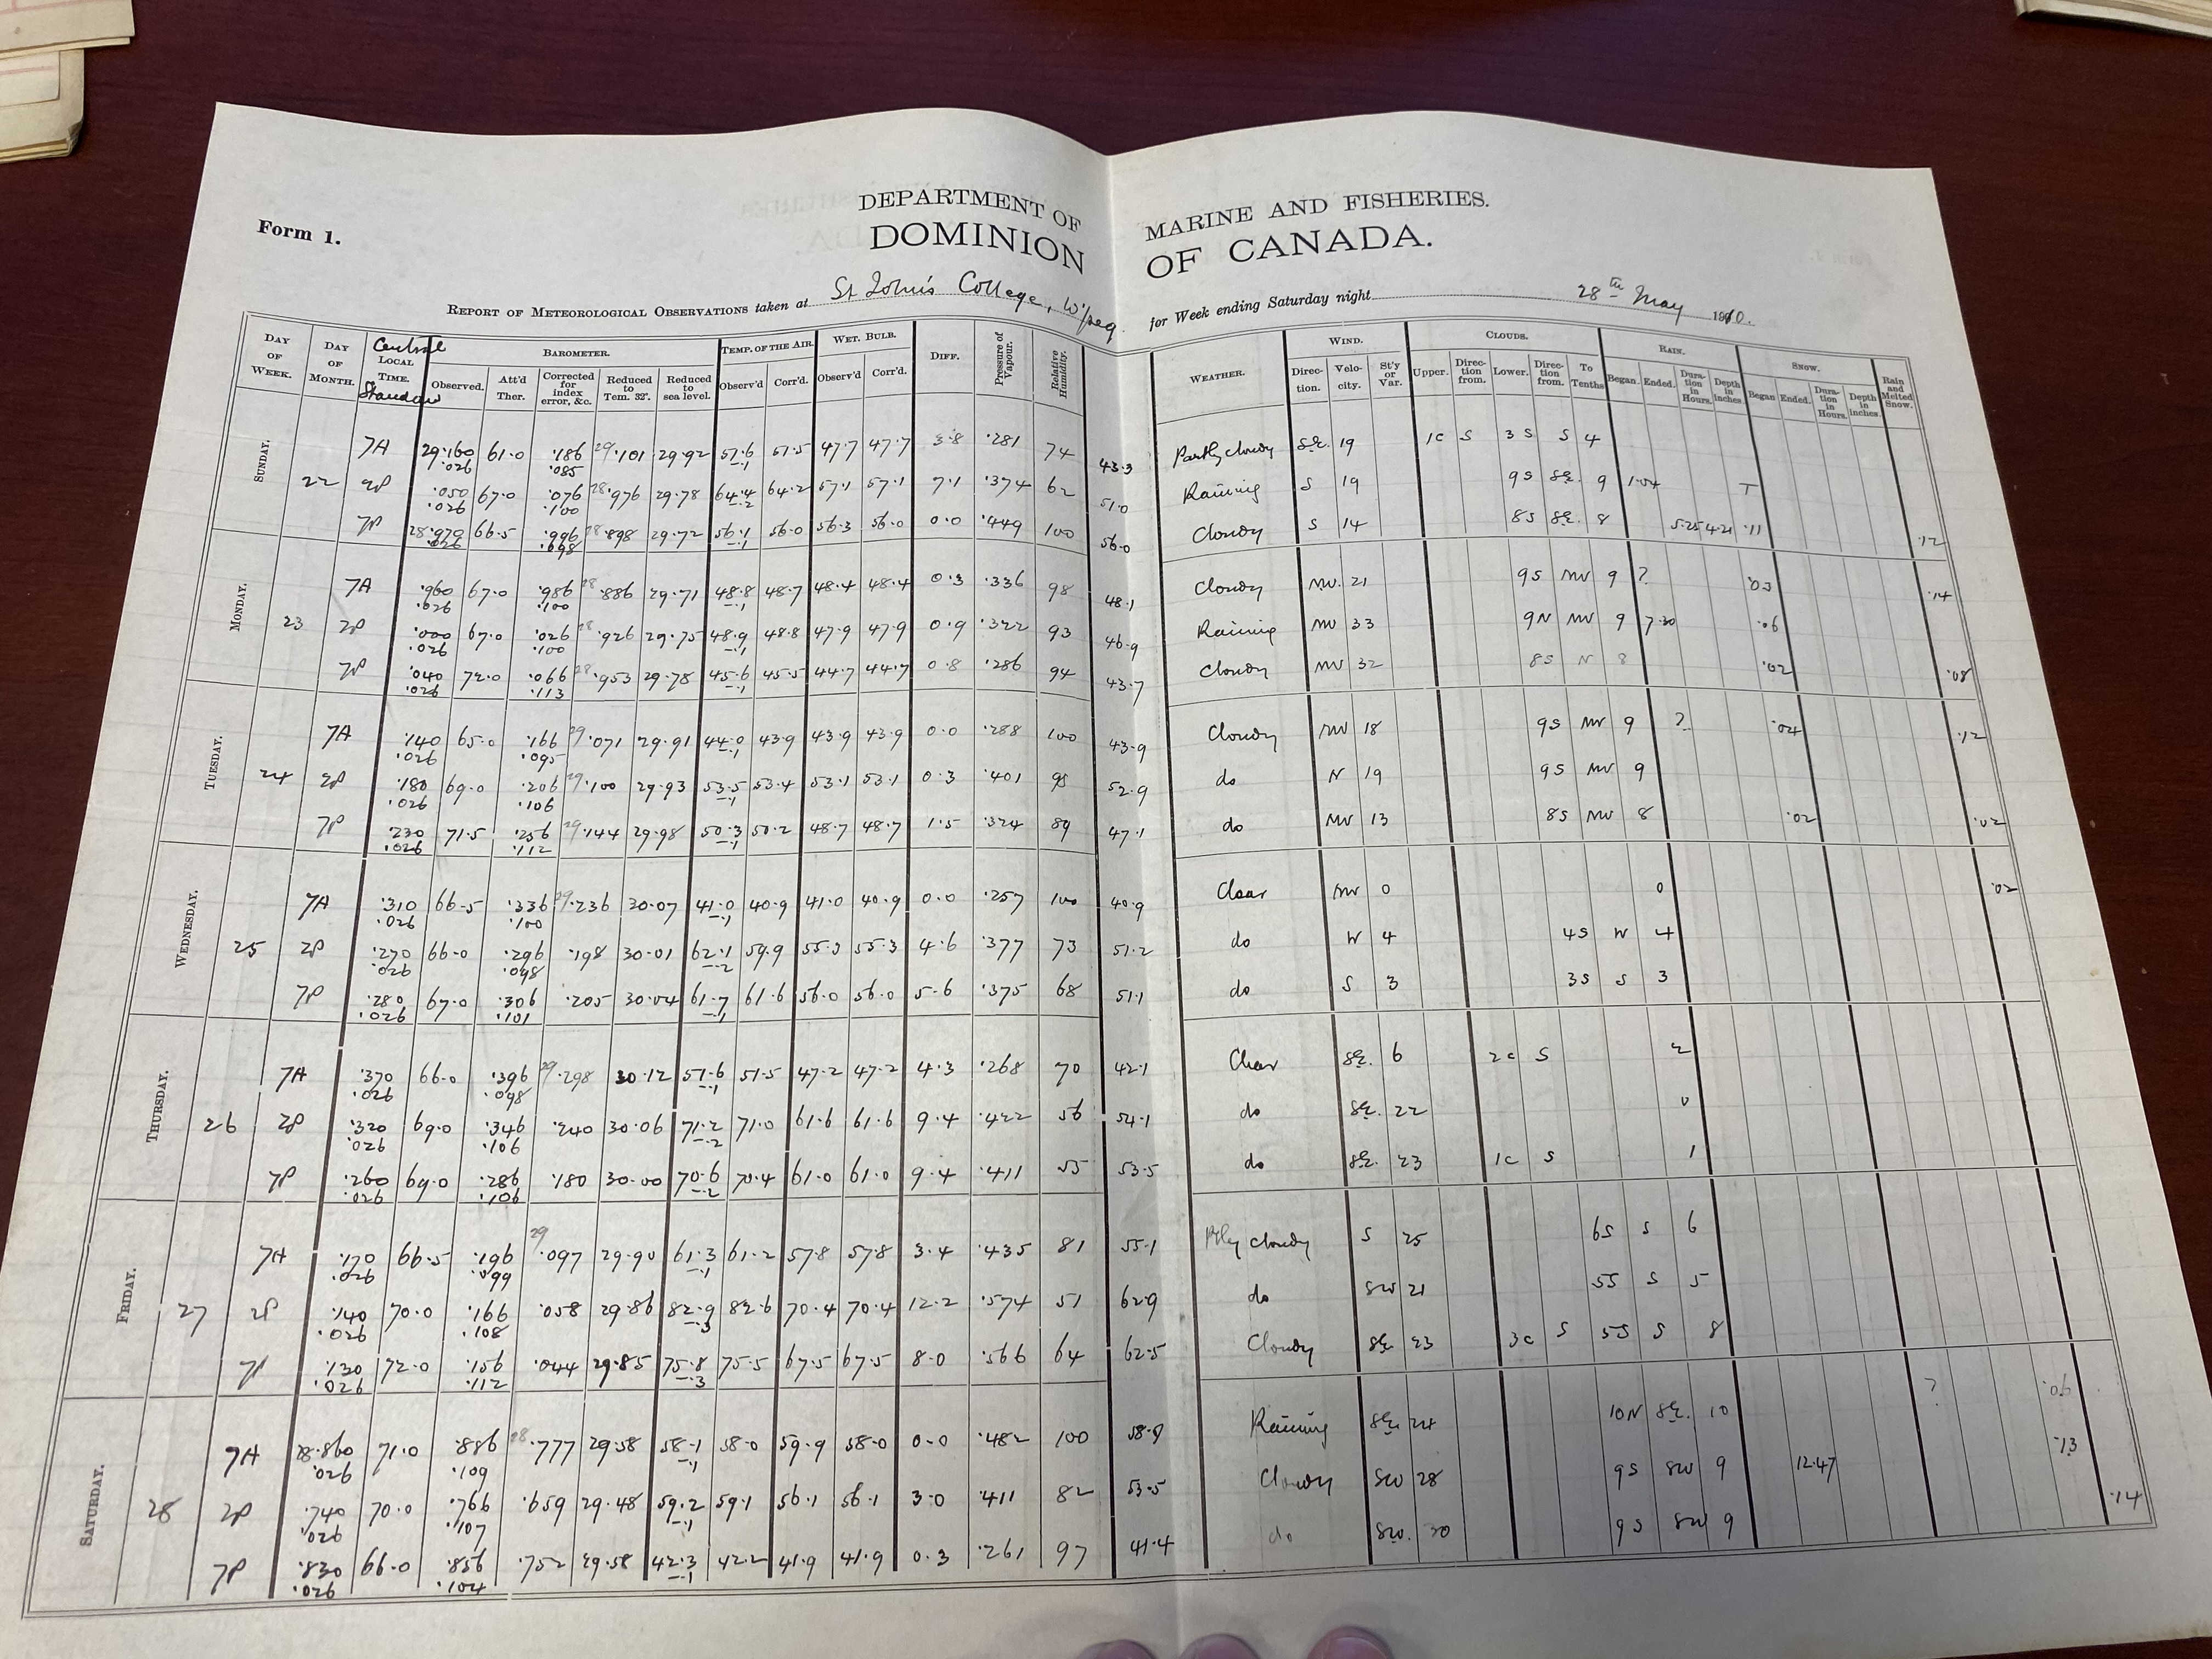
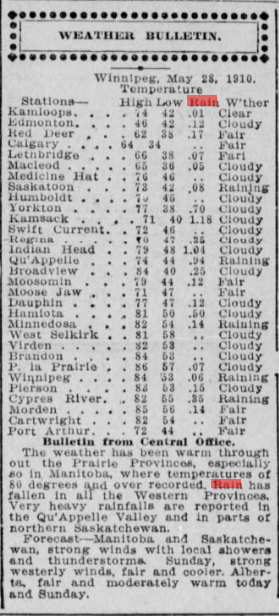
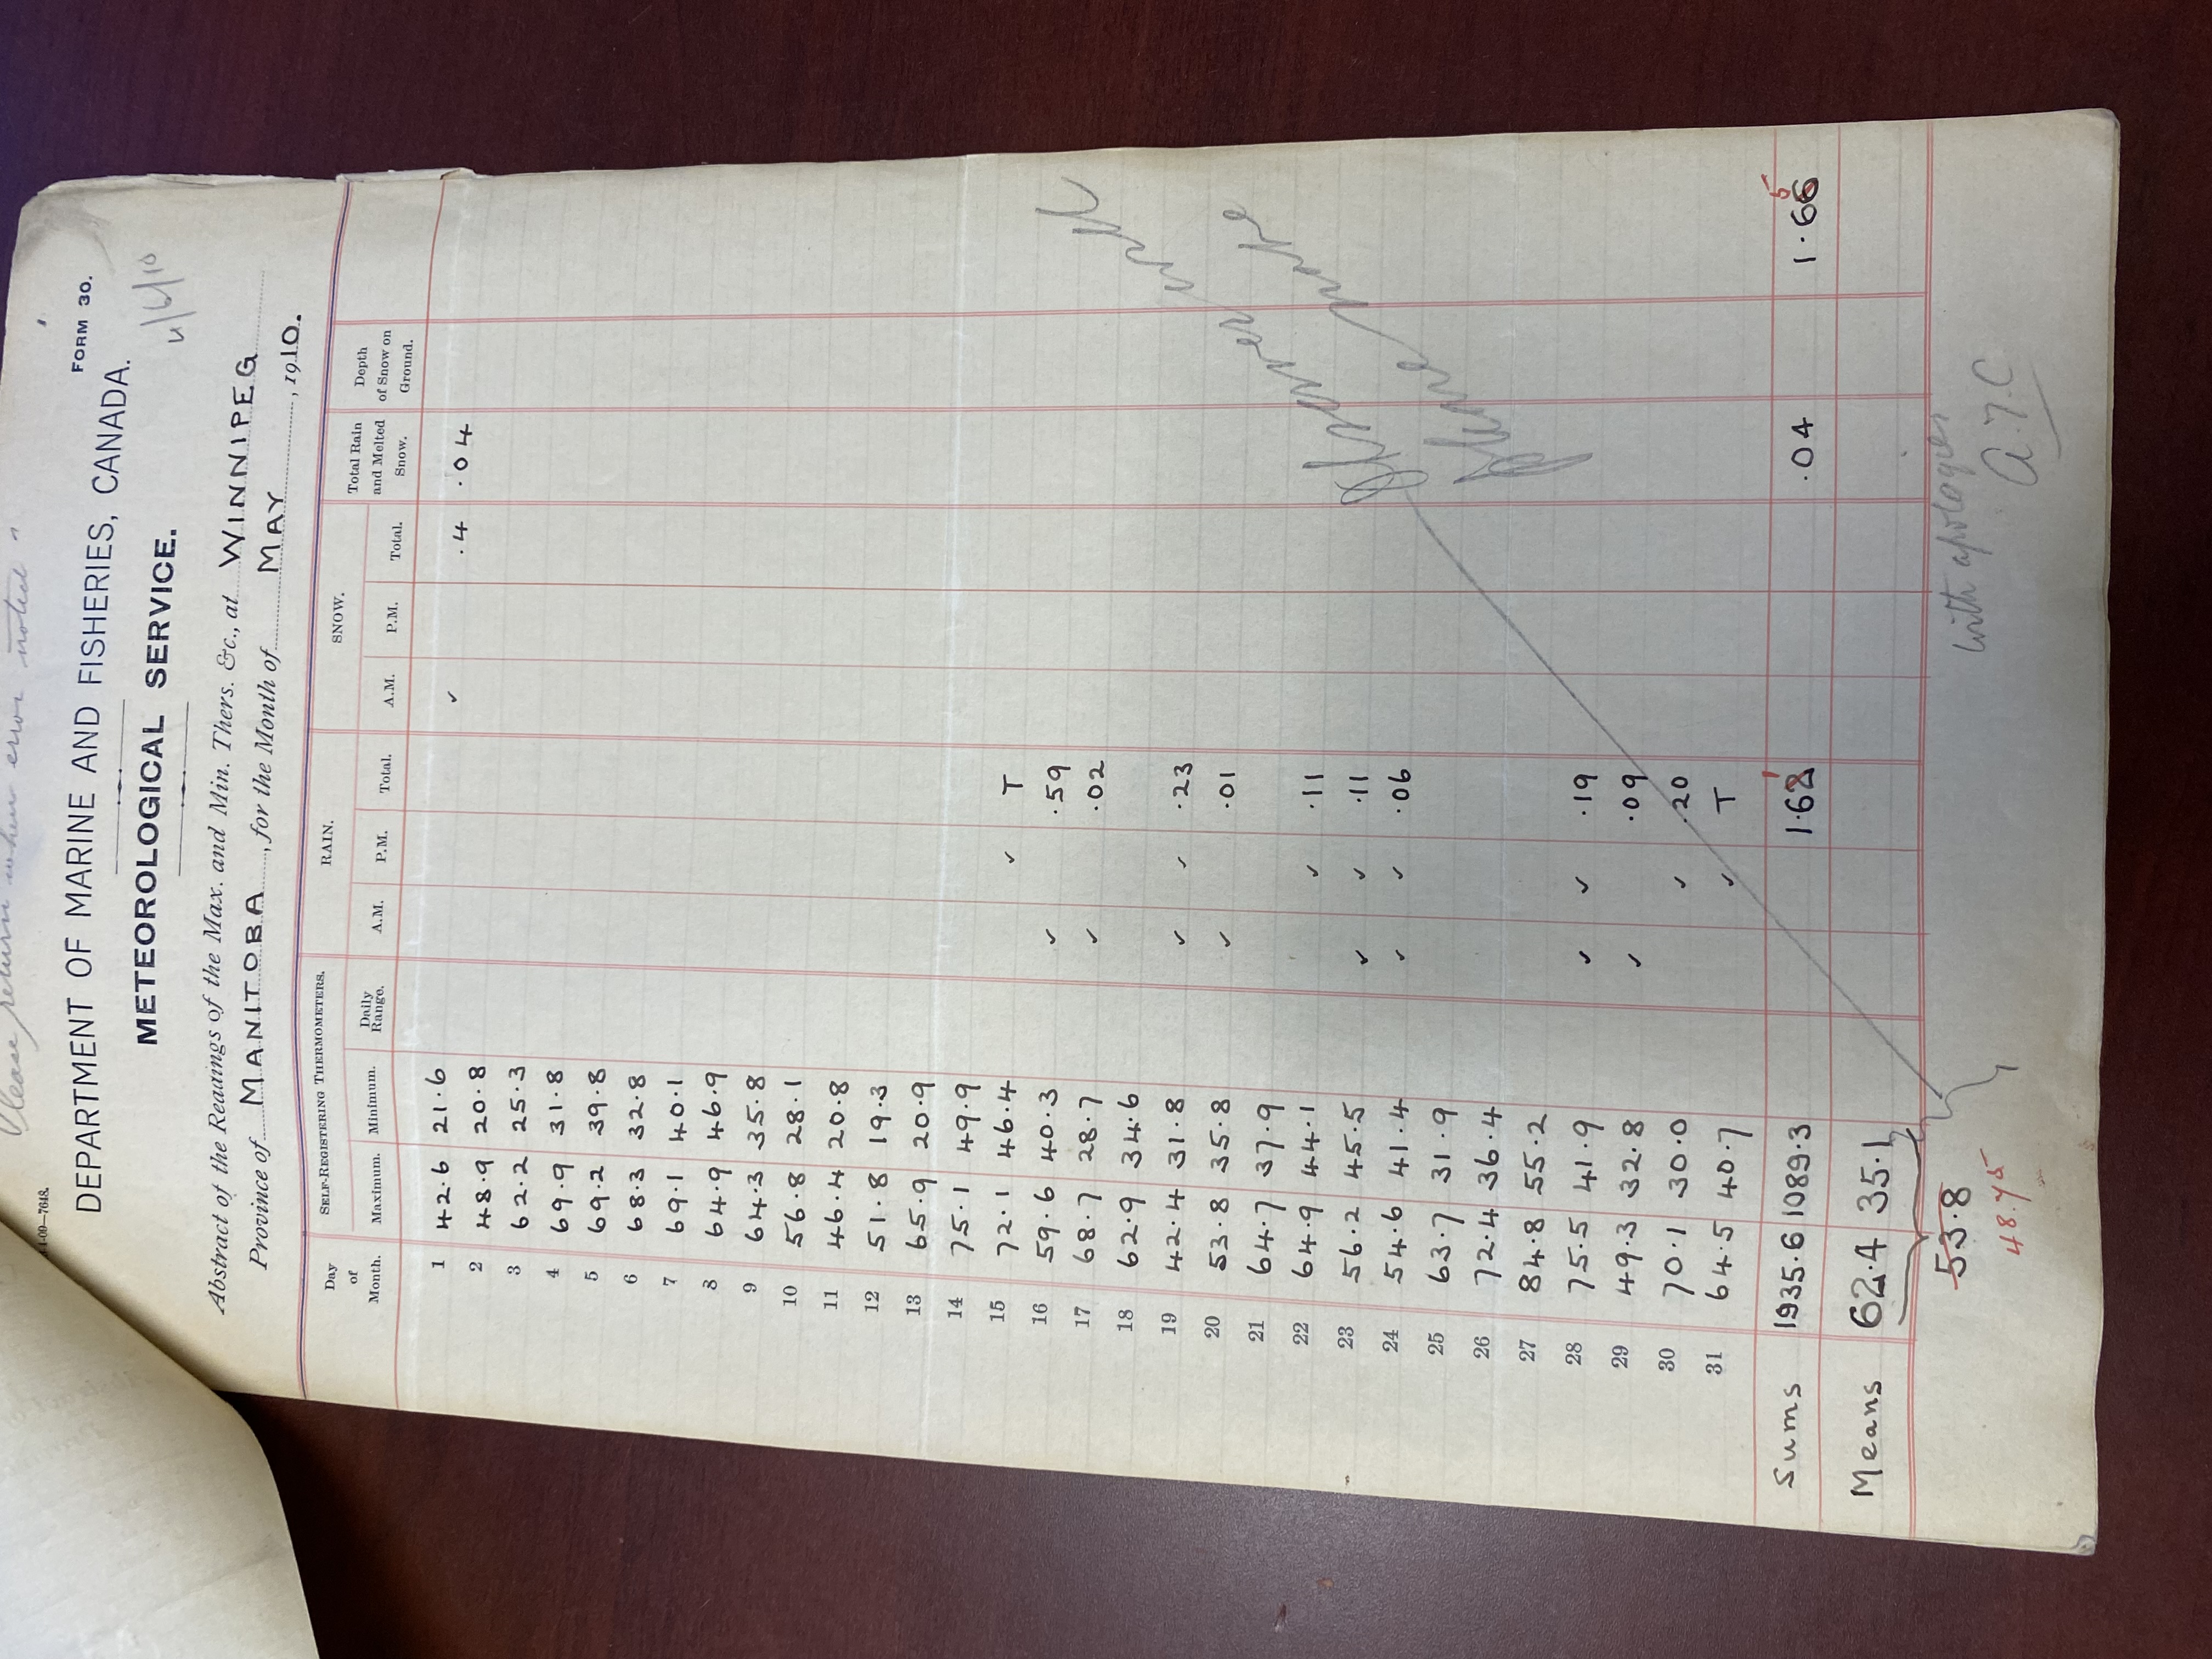
May 28, 1910 - 4.8 cm snowfall on May 28 was erroneous and eliminated. Observer notes from St John's College revealed that the rain amounts were mistakenly entered in the snow column for the date. Further evidenced by the fact that the snow amounts were entered when temperatures were 14-15c, far too warm for snow to fall. The observer, in their notes, also reported that rain was falling, not snow. The monthly summary from the observer showed no snow, and instead rain (4.8 mm) on the date. In addition, newspapers (note that this paper's 2.2 inches of rain is an error for 0.22 inches) had no mention of snowfall. They instead talked about rains that fell.
May 8, 1930 - 49.0 mm of rain/precip actually fell on the 7th and 8th combined. This is something imported from the ECCC archives.
May 15, 1996 - ECCC entered precip amounts using a 6am-6am climate day instead of the usual midnight-midnight. I changed the values to a midnight-midnight climate day, using synops. This resulted in the rain/precip of 21.2 mm being changed to 15.0 mm on this day, causing no record to be broken.
May 7, 1997 - The climate day has been changed to midnight-midnight instead of the 6am-6am in the ECCC Archives.
May 13, 1997 - 1.4 cm of snow entered on the 12th actually fell on the 13th during the overnight. Moved the amount to the 13th as a result (1.4 cm + 0.4 cm = 1.8 cm).
May 13, 2009 - Spurious 0.5 mm on the 14th was moved to the 13th, assumed to be leftover. This increased the rain/precip to 38.5 mm from 38.0 mm for this date.
May 17, 2015 - Rainfall estimated due to a switcheover from rain to snow between hourlies in the evening.
Graph form:

