Top 30 Wettest YEARS - WINNIPEG (since 1873)
|
Rank |
Rainfall
(mm) |
Snowfall
(cm) |
Precipitation
(mm) |
Rank |
|||
|
1 |
660.2 |
2022 E |
266.1 |
1909 |
792.0 |
2022 U |
1 |
|
2 |
633.5 |
1977 |
243.8 |
1955 |
723.3 |
1962 |
2 |
|
3 |
628.5 |
2010 E |
242.2 |
1996 |
718.4 |
1953 |
3 |
|
4 |
621.6 |
2000 |
226.2 |
1874
O |
715.0 |
1977 |
4 |
|
5 |
612.1 |
1994 C |
219.7 |
1916 |
708.0 |
2010 E |
5 |
|
6 |
590.7 |
1962 |
203.0 |
2022
E |
701.6 |
2000 |
6 |
|
7 |
586.6 |
1968 |
202.0 |
1893 |
690.6 |
1898 |
7 |
|
8 |
568.7 |
1953 |
197.9 |
1873 |
682.5 |
2004
E |
8 |
|
9 |
561.6 |
1993 |
184.8 |
1936 |
677.5 |
1994 C |
9 |
|
10 |
558.4 |
1896 |
184.2 |
1950 |
673.8 |
1996 |
10 |
|
11 |
555.1 |
1959 |
183.6 |
1884 |
668.1 |
1896 |
11 |
|
12 |
542.3 |
1879 |
180.9 |
1935 |
660.3 |
1954 |
12 |
|
13 |
540.8 |
1901 |
179.9 |
1898 |
653.0 |
1879 O |
13 |
|
14 |
539.5 |
2004
E |
178.5 |
1949 |
652.9 |
1959 |
14 |
|
15 |
538.8 |
1877 O |
178.1 |
1894 Z |
652.1 |
1968 |
15 |
|
16 |
535.4 |
1973 |
177.3 |
1965 |
639.6 |
1884 |
16 |
|
17 |
531.8 |
1954 |
172.5 |
1919 |
638.3 |
1919 |
17 |
|
18 |
528.3 |
1941 |
171.6 |
2004 |
635.7 |
2005
E |
18 |
|
19 |
526.5 |
1984 |
171.1 |
1932 |
632.7 |
1890 |
19 |
|
20 |
518.5 |
2005
E |
169.6 |
1962 |
624.9 |
1941 |
20 |
|
21 |
511.1 |
1890 |
169.0 |
1933 |
621.3 |
1993 |
21 |
|
22 |
510.8 |
1898 |
168.4 |
1904
Z |
618.1 |
1991 |
22 |
|
23 |
508.3 |
1912 |
168.2 |
2013 |
617.9 |
1944 |
23 |
|
24 |
507.9 |
1880 |
167.7 |
1910
C |
614.3 |
1916 |
24 |
|
25 |
504.4 |
1911 |
167.7 |
1964 |
613.2 |
1873 |
25 |
|
26 |
500.4 |
1944 |
163.7 |
1970 |
607.8 |
1893 |
26 |
|
27 |
493.8 |
1878 O |
162.5 |
1956 |
607.0 |
1901 |
27 |
|
28 |
480.7 |
1975 |
161.4 |
1947 |
606.4 |
1984 |
28 |
|
29 |
475.6 |
1927 |
161.0 |
1991 C |
603.8 |
1956 |
29 |
|
30 |
470.0 |
2016
E |
157.5 |
1887 |
601.6 |
1973 |
30 |
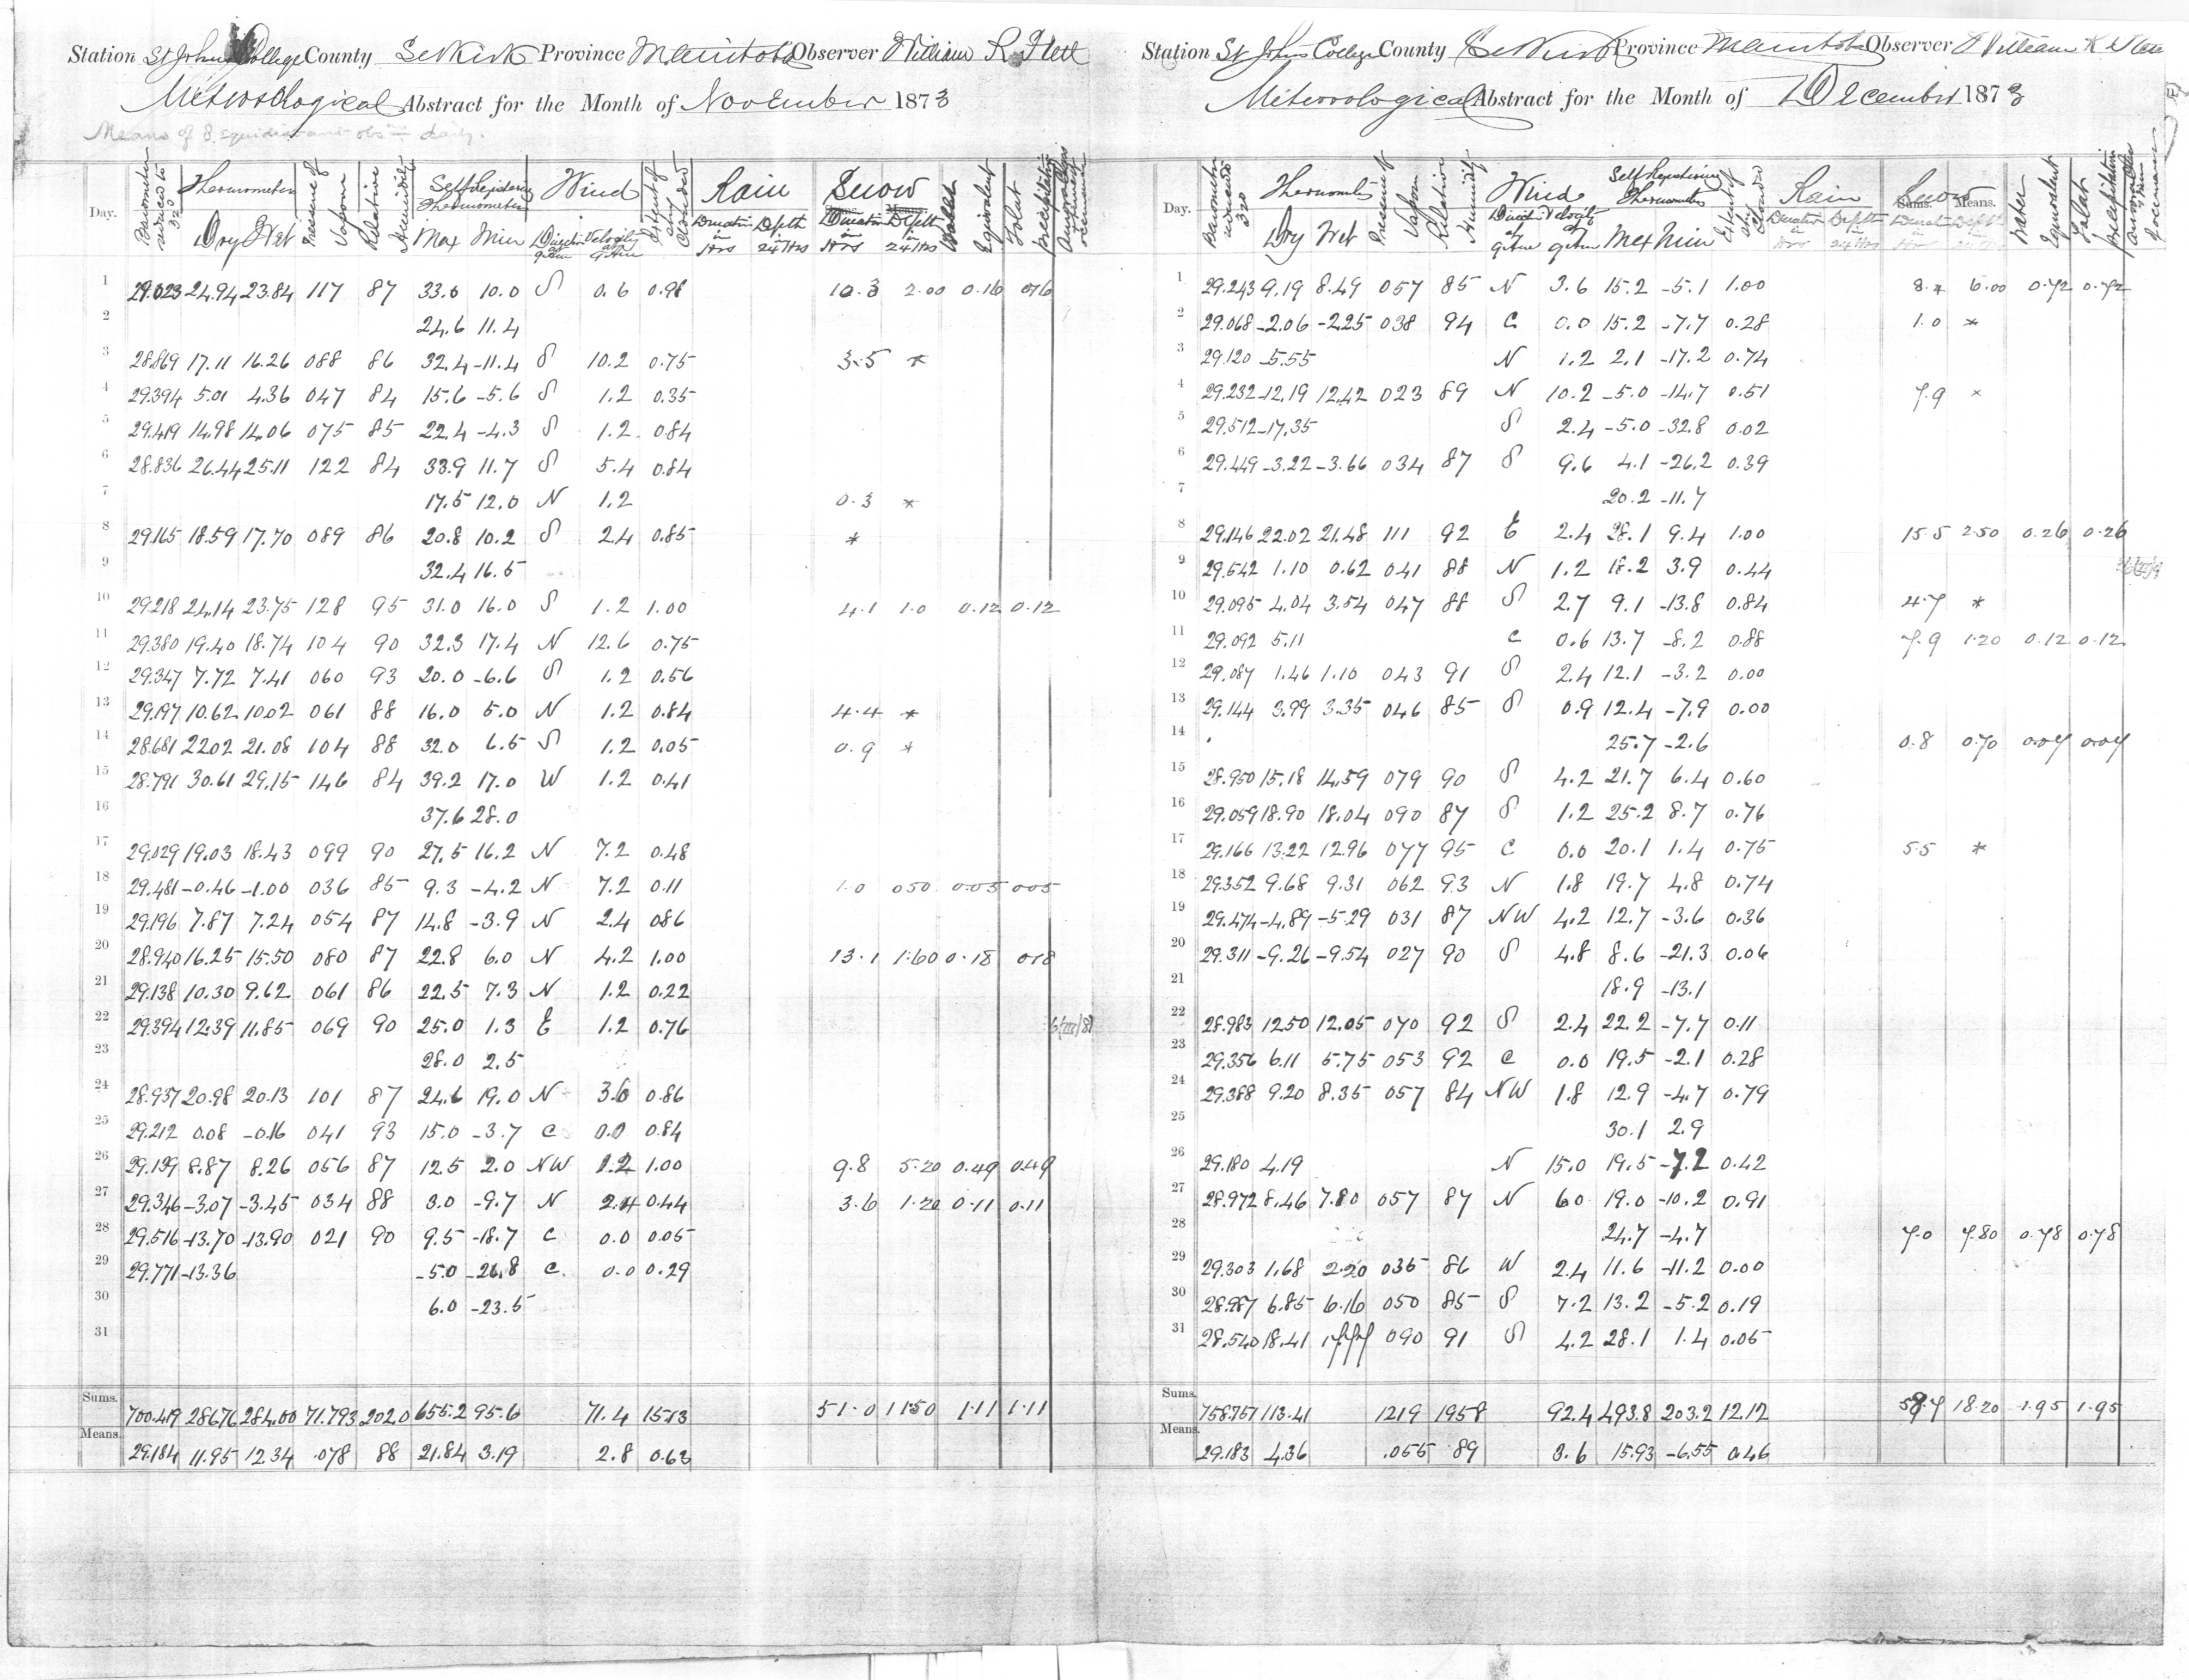
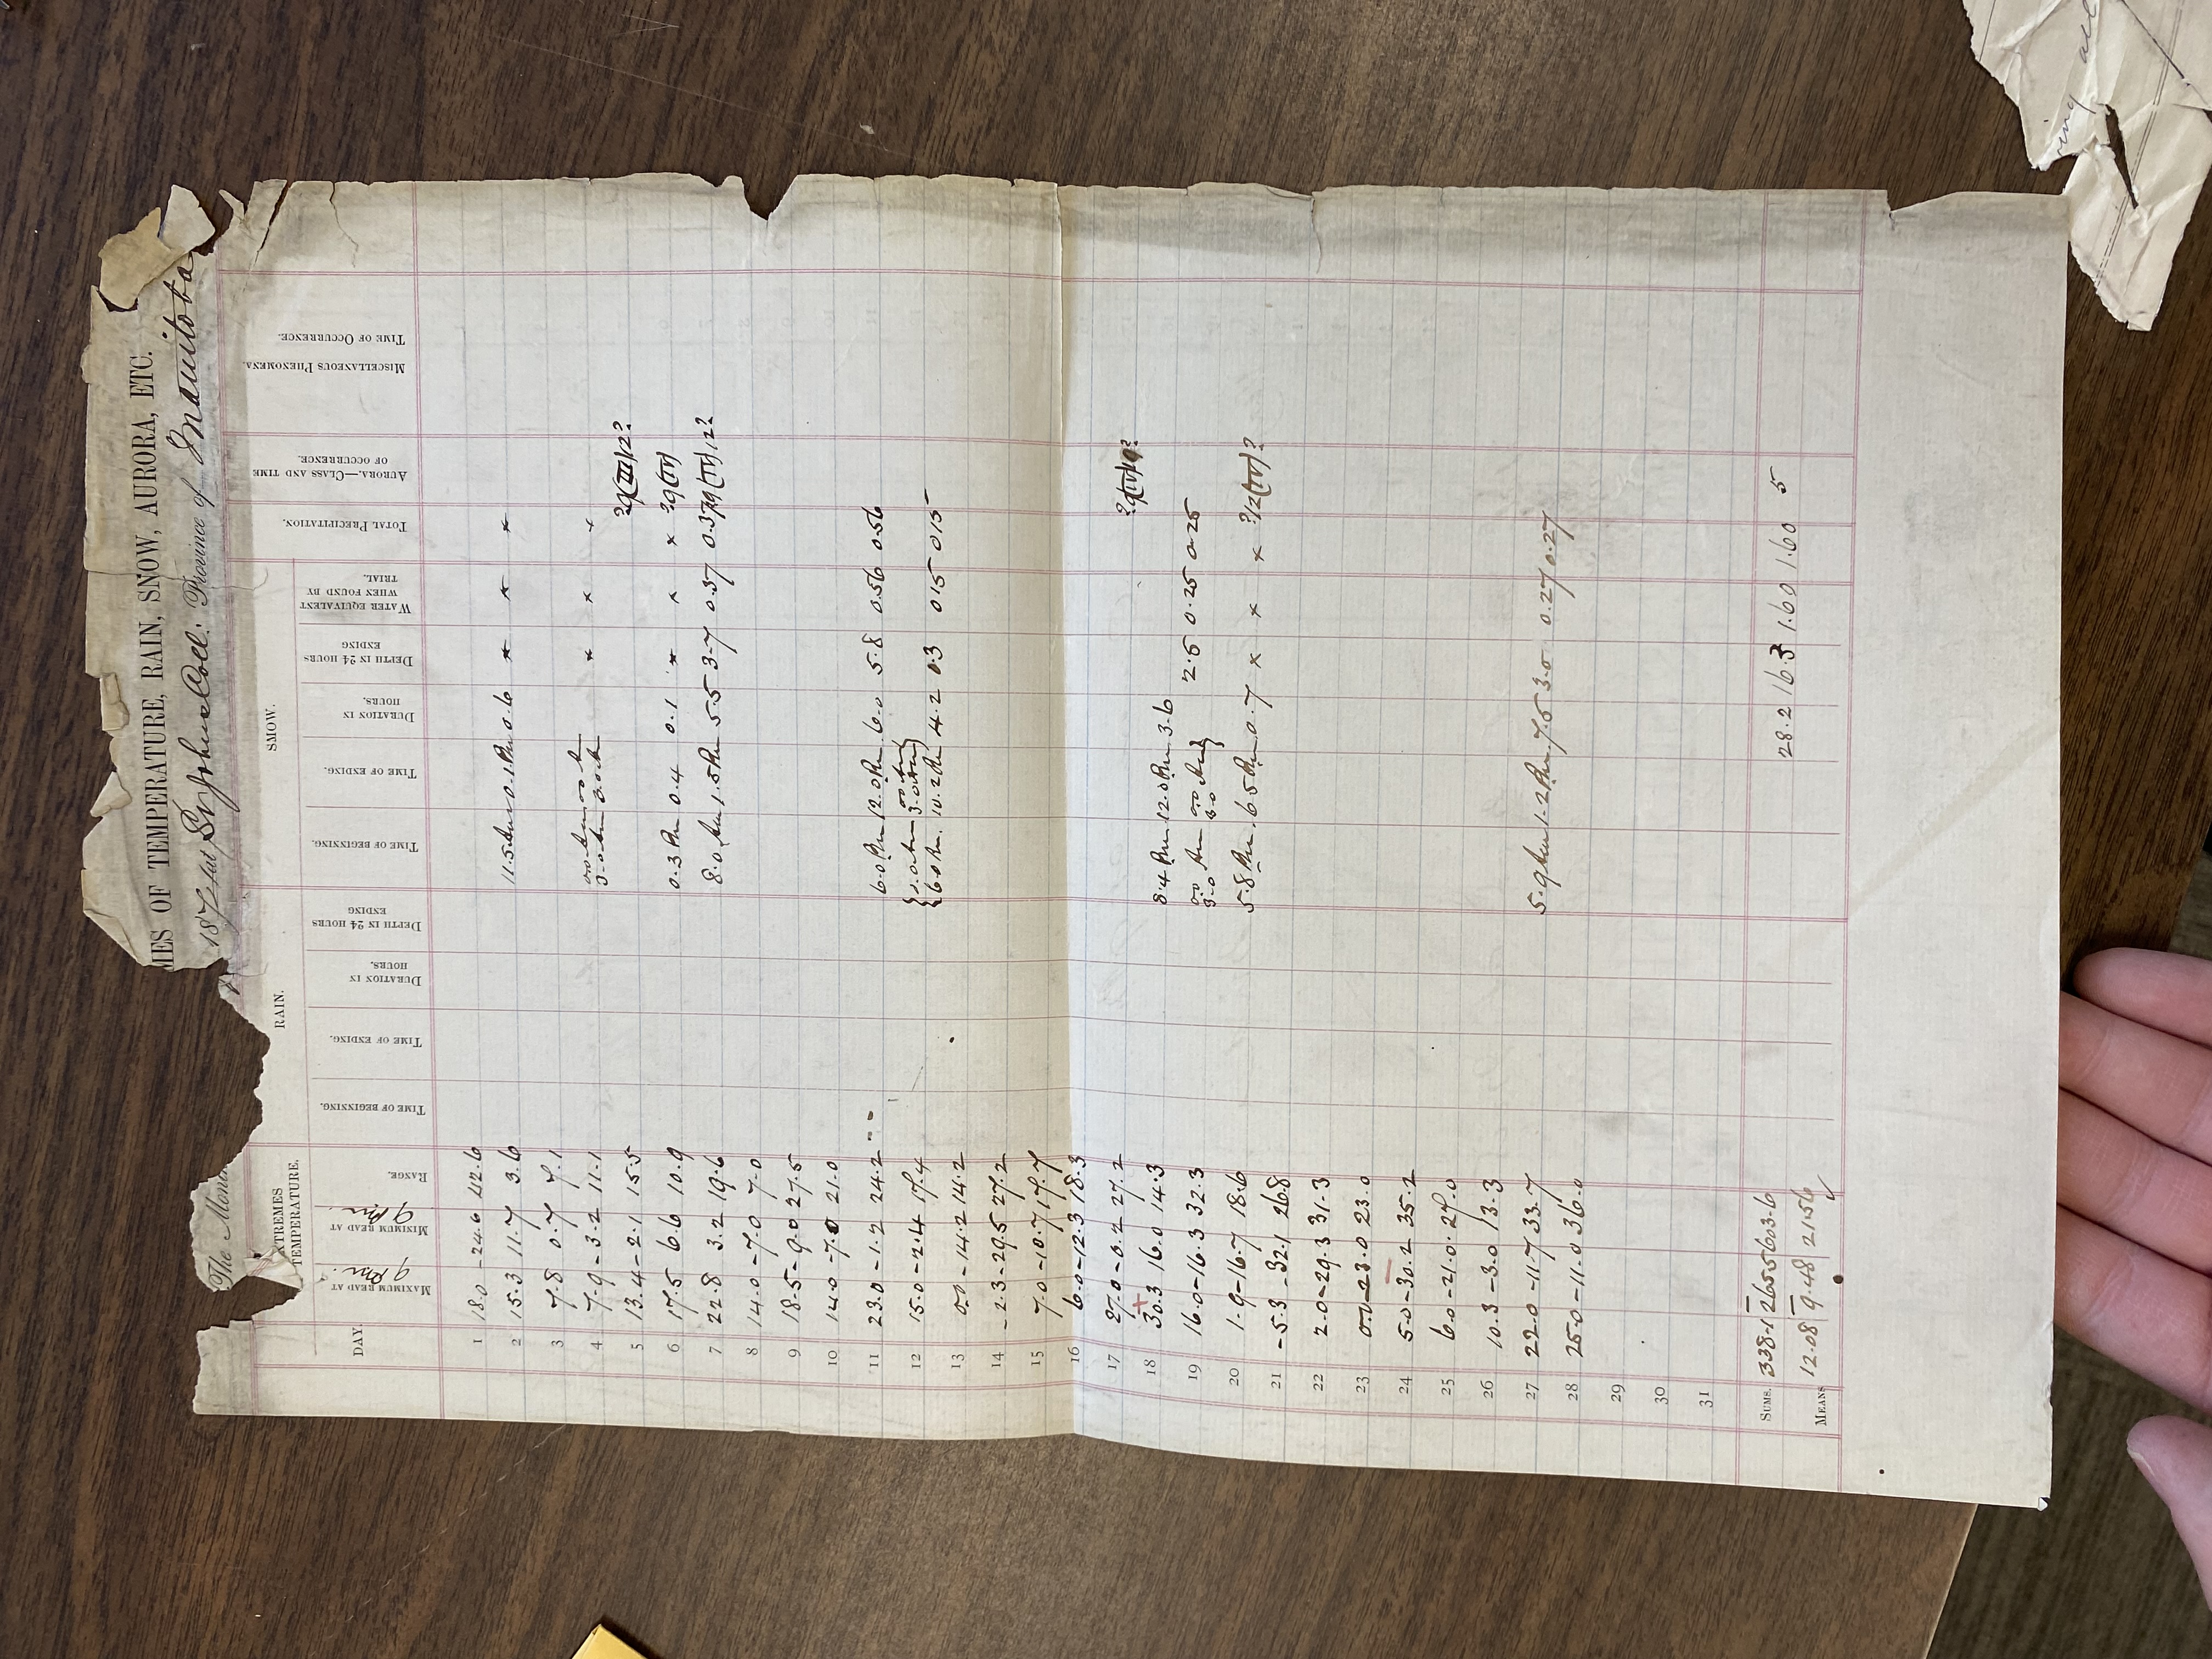
1874 - Missing data for February for St John's College were found at the Library and Archives of Canada in Winnipeg (38.9 cm).
1877 - Some rain/precip amounts found in the observer notes for July (6th - 3.0 mm) and September (19th and 26th - 6.9 mm and 8.4 mm) were, for an unknown reason, omitted in the ECCC Archives. I have added these amounts, raising the yearly rainfall from 520.5 mm to 538.8 mm. The missing amounts were corroborated by St Andrews which also had rainfall amounts on these dates.
1878 - Some rain/precip amounts found in the observer notes for June (22nd - 5.6 mm), July (2nd - 7.9 mm) and September (6th - 1.3 mm) were, for an unknown reason, omitted in the ECCC Archives. I have added these amounts, raising the yearly rainfall from 479.0 mm to 493.8 mm. The missing amounts were corroborated by St Andrews which also had rainfall amounts on these dates.
1879 - A precip/snow amount found in the observer notes for January (19th - 1.5 mm) was omitted in the ECCC Archives. I have added this amount, raising the yearly precipitation from 651.5 mm to 653.0 mm. The missing amount was corroborated by St Andrews which also had precip/snow on this date.
1894 - Snowfall - There was likely more snow from an event on October 2nd, however, it is unclear how much accumulation occurred October 2nd because of inconsistent observations from the observer. One page noted 1/10 inch (0.3 cm) and another 1.5 inches (3.8 cm). Other pages have no accumulation at all which is unlikely. See the notes on this page for more details. There is enough evidence to support accumulation. This would raise the yearly amount by up to 4 cm.
1904 - A note about snowfall exists for December 1904.
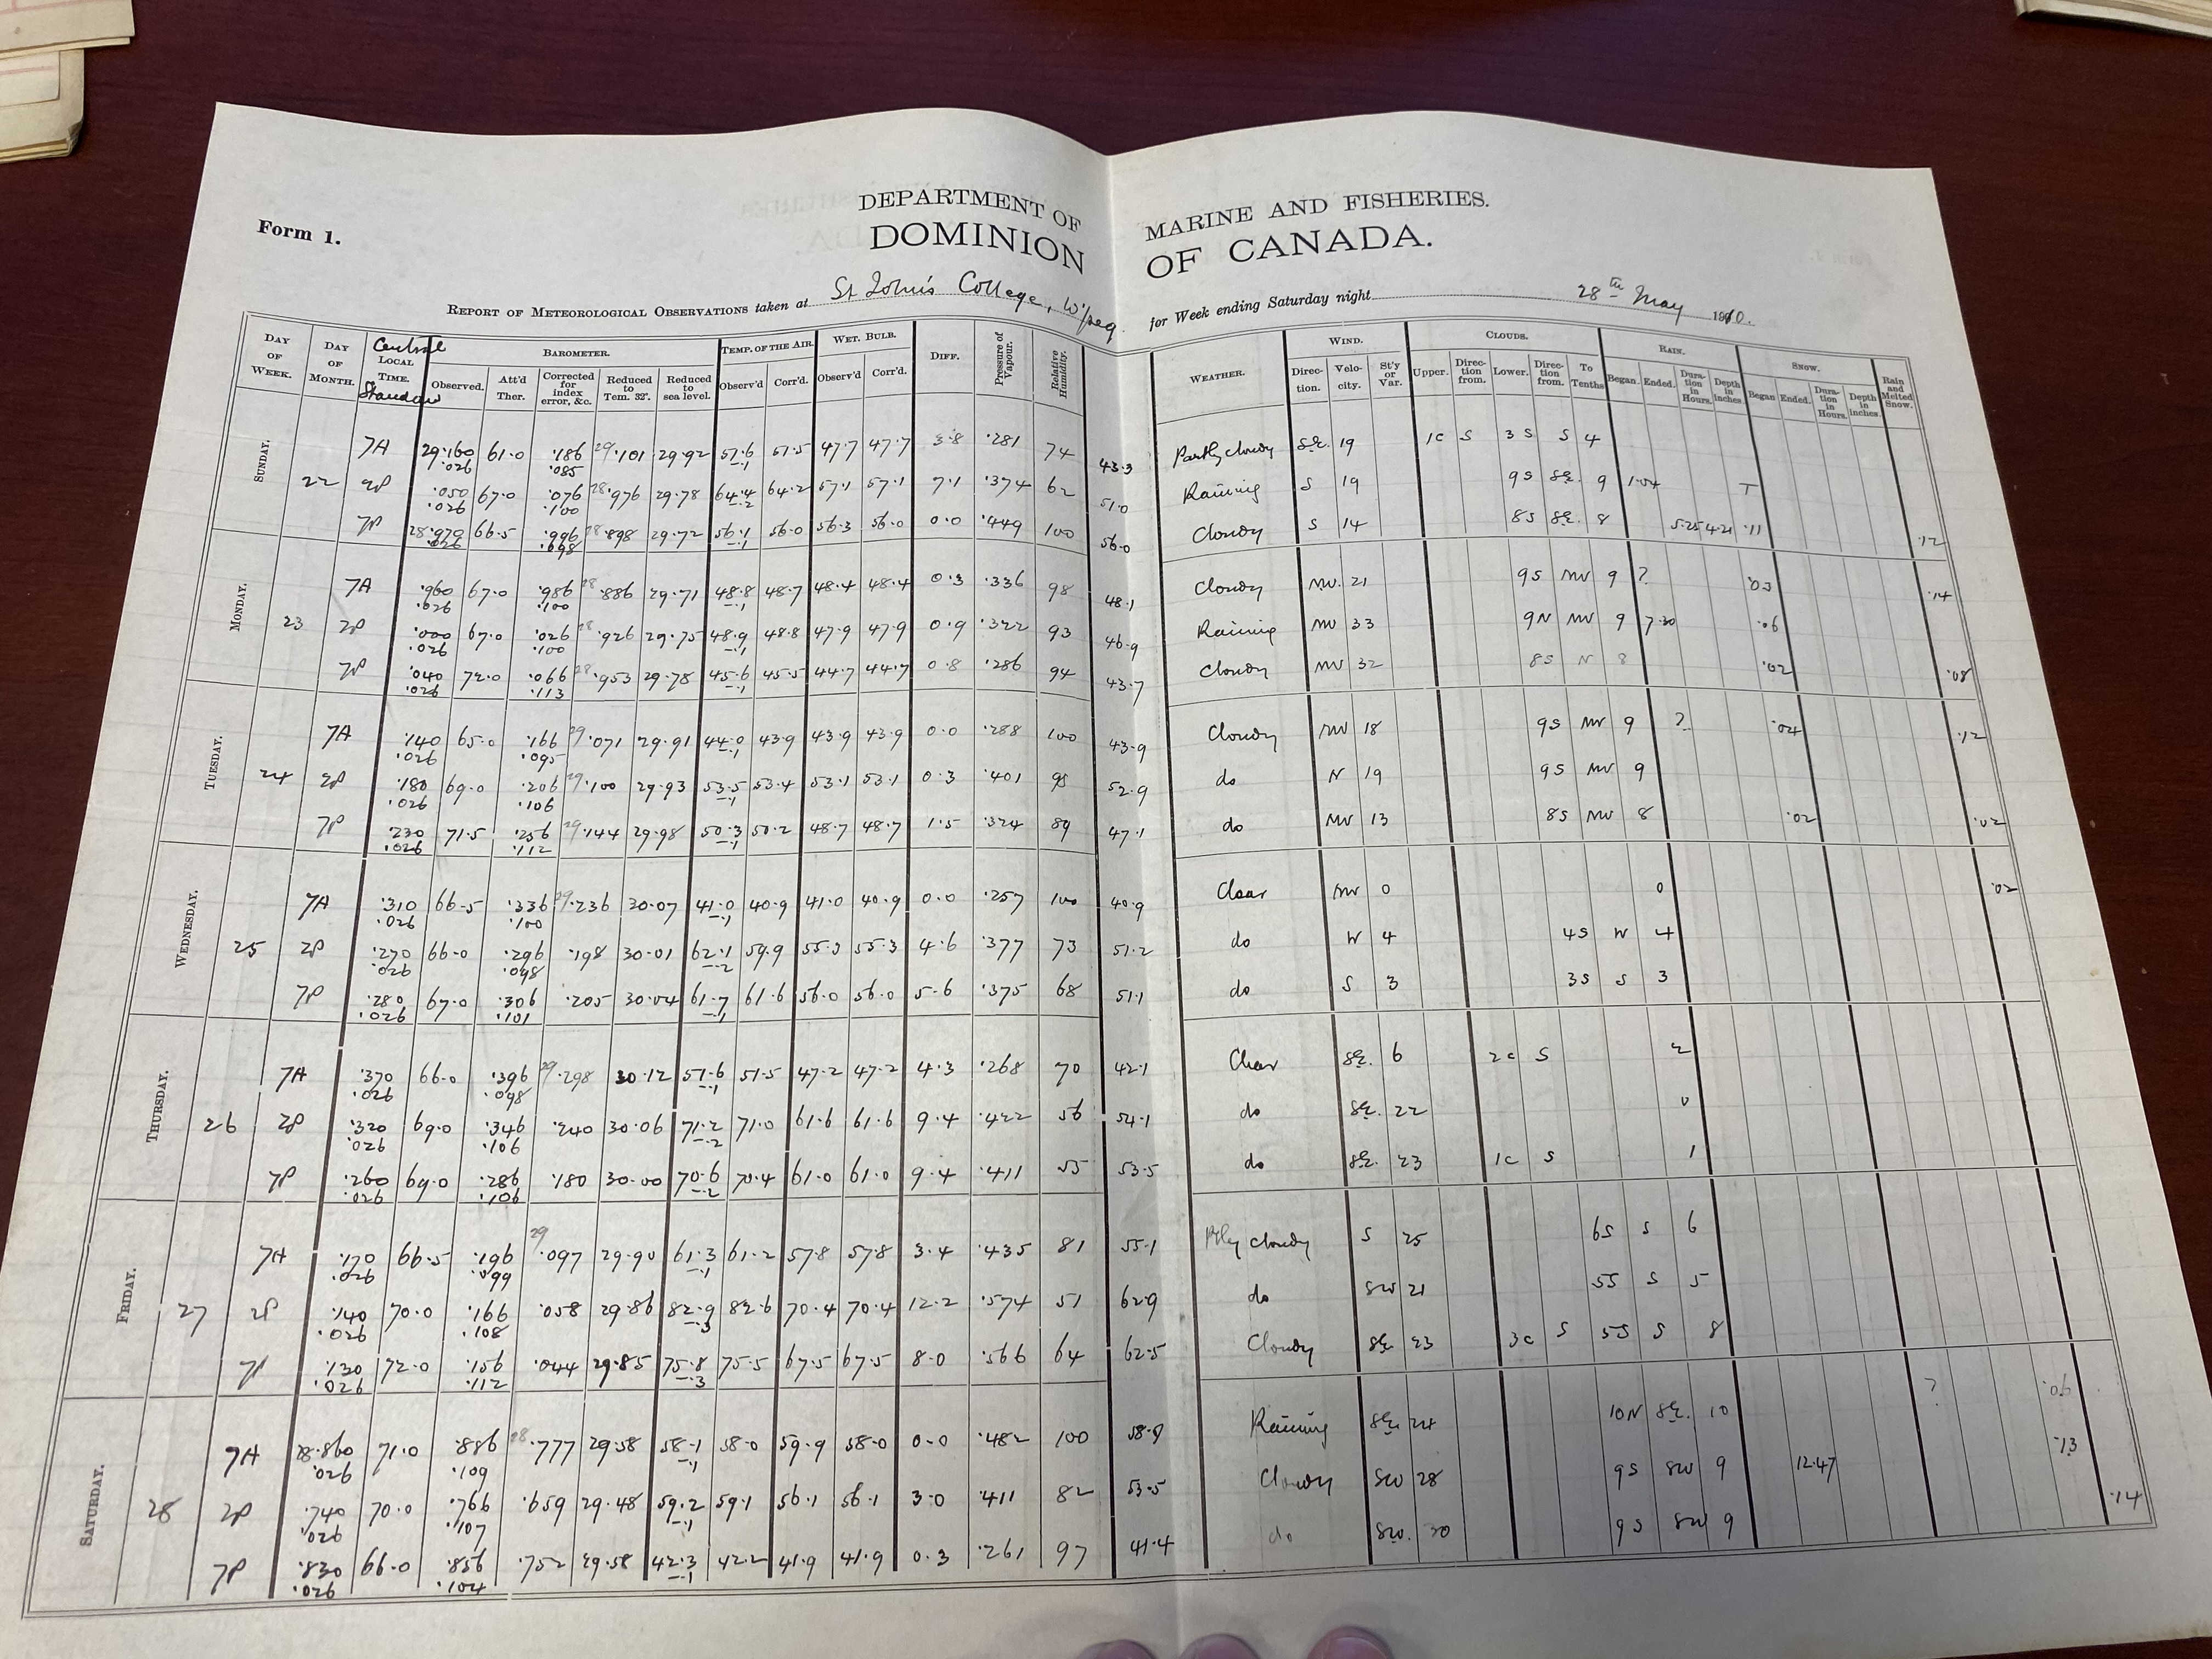
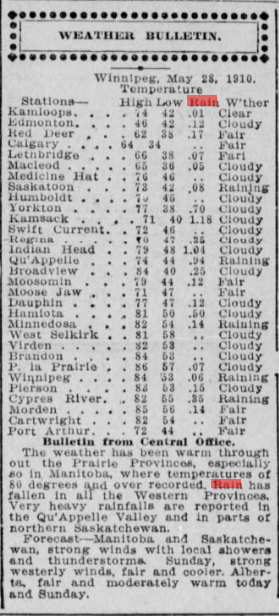
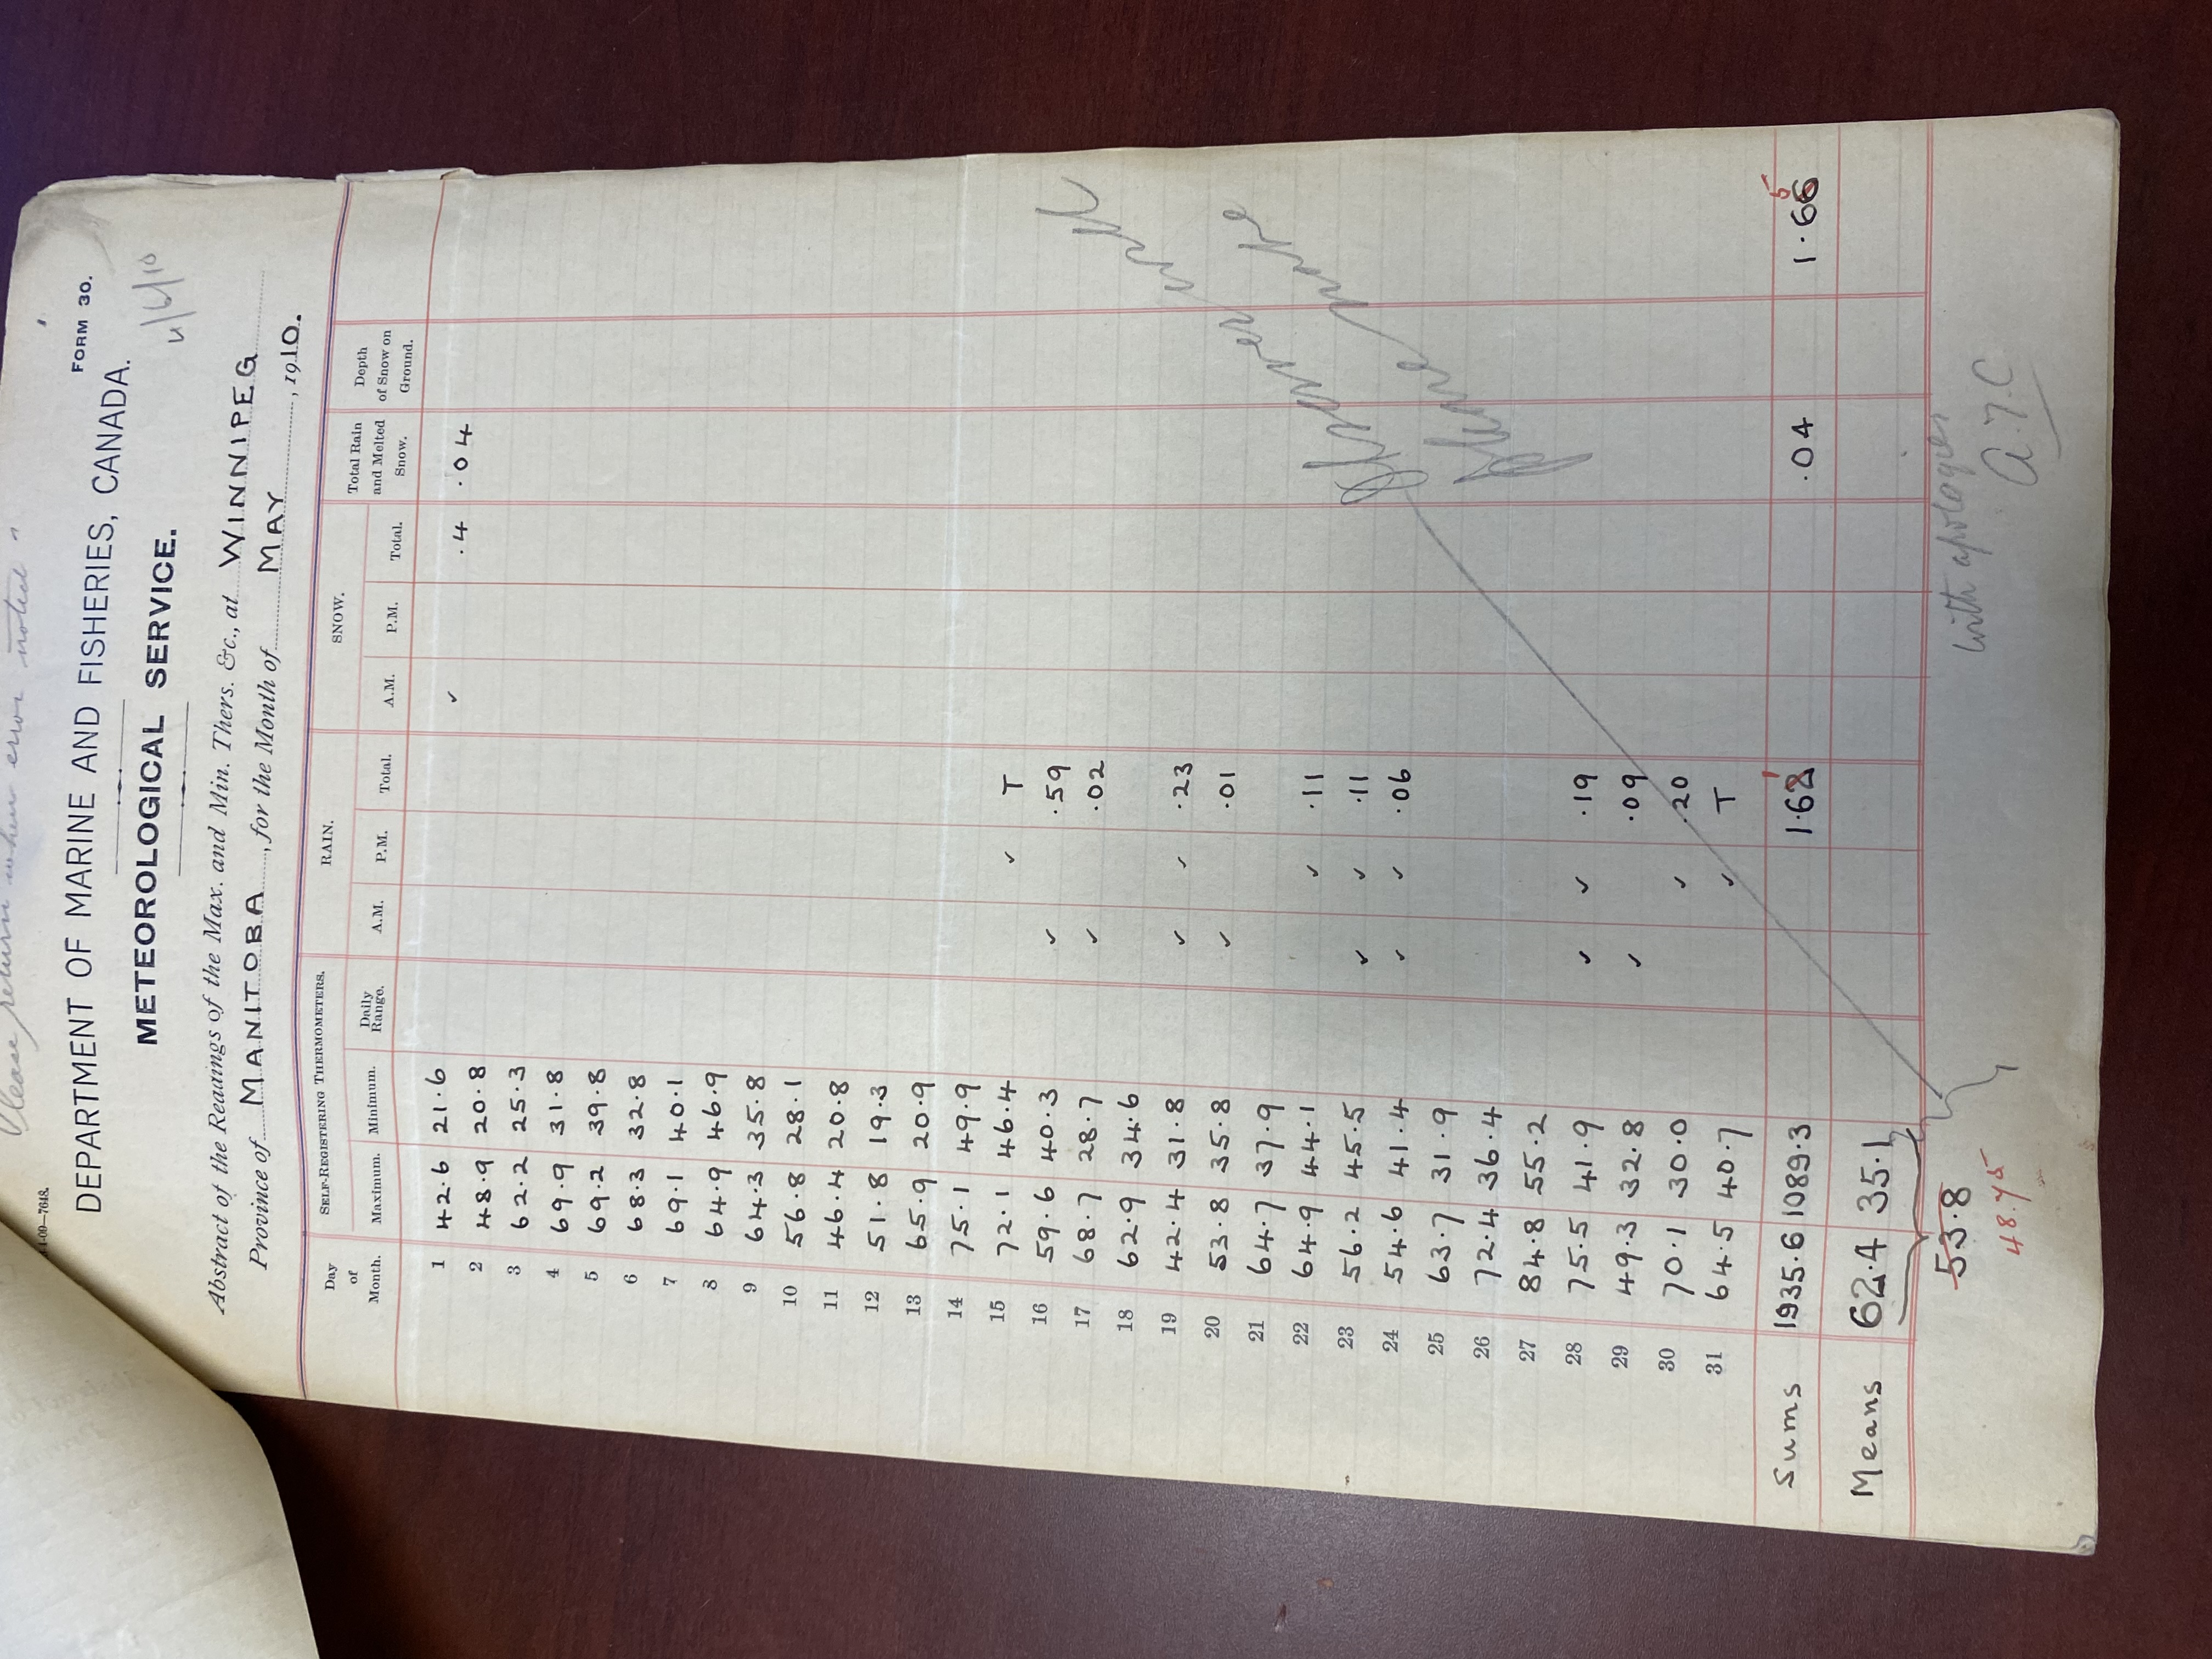
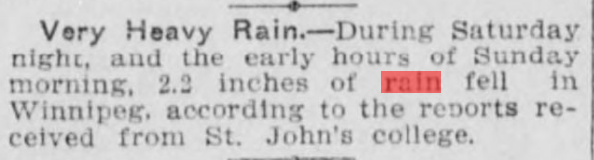
1910 - 4.8 cm snowfall on May 28 was erroneous and eliminated, resulting in a reduction of 4.8 cm for the year. Observer notes from St John's College revealed that the rain amounts were mistakenly entered in the snow column for the date. Further evidenced by the fact that the snow amounts were entered when temperatures were 14-15c, far too warm for snow to fall. The observer, in their notes, also reported that rain was falling, not snow. The monthly summary from the observer showed no snow, and instead rain (4.8 mm) on the date. In addition, newspapers (note that this paper's 2.2 inches of rain is an error for 0.22 inches) had no mention of snowfall. They instead talked about rains that fell. As a result, rainfall amounts for the year were increased by 4.8 mm as a result of the switch from snow to rain.
1991 - Synops suggest higher snowfall amounts than shown in the ECCC Archives for January 8th (1.8 cm) and 10th (0.8 cm), and March 13th (3.2 cm). Not sure why ECCC assumed a 10:1 ratio on these dates when actual snowfall measurements were available. An ECCC publication also confirmed the accuracy of the synops. I have updated the amounts to match synops as a result. This raised the yearly snowfall amount from 159.8 cm to 161.0 cm.
1994 - Do not know where the 2.8 mm of rain/precip on April 15 in the ECCC Archives originated from because synops had nothing, and an ECCC publication showed nothing. Also no evidence of precip falling this day, which was mostly sunny. I have eliminated the amount as a result, dropping the yearly rainfall and precip by 2.8 mm.
2000 - Note that 0.5 mm of rain on May 13th was not true rainfall - it was actually snow melting on contact in the morning.
2004 - See March comment about rainfall (rain mistakenly entered as snow on Mar 28) as well as a May comment (plus or minus a couple mm), an October comment (plus or minus 1 mm) and a December comment (rain mistakenly entered as snow). On April 15, likely a portion of the 6.5 mm of rain reported in the Archives was not actually rain - either mistakenly forgot to enter some snowfall, or snow melting on contact entered as rain. Either way, it would affect the rain amount by only within 1 mm. I have not changed the value. On July 15, 1.0 mm in synops was not entered in the Archives for some reason (happened during a thunderstorm). I have added the 1 mm. These corrections raised the yearly rainfall from 524.5 mm to 539.5 mm and dropped the yearly precip from 682.6 mm to 682.5 mm.
2005 - On Feb 13, rain was mistakenly entered as snow and in addition, the 1.5 mm recorded was way too high given very short lived rainfall (less than half an hour in duration). This might indicate a nipher shield issue if it was in place. No other stations in the city recorded any accumulation. I have eliminated the 1.5 mm as a result. On March 10, at least some rain should have been recorded. I have assumed 2.0 mm (Charleswood 1.6 mm). On April 27, snow was mistakenly entered as 0.5 mm rain (I eliminated the 0.5 mm rain). On Oct 5, a portion of the rain was actually snow, possibly melting on contact (at least 2 mm was not true rain), but I have not made any change as of now. However, on Oct 6 I converted the 0.5 mm of rain to snow because it was only snow that fell. On Oct 18, there seems to be an issue where rain/precip was entered too low. Other stations in the city had over 7mm. Inspection of synops shows that 4.0 mm of spurious precip the morning of the 19th was completely ignored. I believe this might have been leftover from the 18th. I have added it to the amounts of the 18th as a result, giving 8.5 mm instead of 4.5 mm. These changes raised the yearly rainfall from 513.0 mm to 518.5 mm, and yearly precipitation from 633.2 mm to 635.7 mm.
2010 - Nipher shield issues causing precip to be high during rain in March and early April at CYWG. CXWG used as replacement as a result, for March 8-11 and 31, and April 2-3. Rainfall on January 23rd is considered estimated due to mixed precipitation. Missing data were filled in on Aug 31 using XWG (0.4 mm) and Nov 10 using synops (0.5 mm). These changes resulted in a net drop of yearly rainfall and precipitation, largely due to the nipher shield issues of spring.
2016 - Rainfall considered estimated due to mixed precipitation on April 5-6 and November 22-29. Accuracy within a few mm.
2022 - Rainfall: Due to some mixed precipitation in March, April and November, rainfall is considered estimated (accuracy within a couple mm). Snowfall: Combination of Charleswood (Jan to May) and Weatherlogics (Linden Woods area) (Oct to Dec). Note Weatherlogics yearly (Jan to Dec) total was 183.9 cm. Precipitation: Raw Airport amount is 766.4 mm. The Airport suffered from under catch of snowfall in windy blowing snow events. The Forks (Jan to Apr) and Weatherlogics (Nov and Dec) used as replacements in these cases. The reason for not using The Forks in Nov and Dec is because it suffered from spurious precip amounts making it unreliable.
Graphs:
Rainfall:


